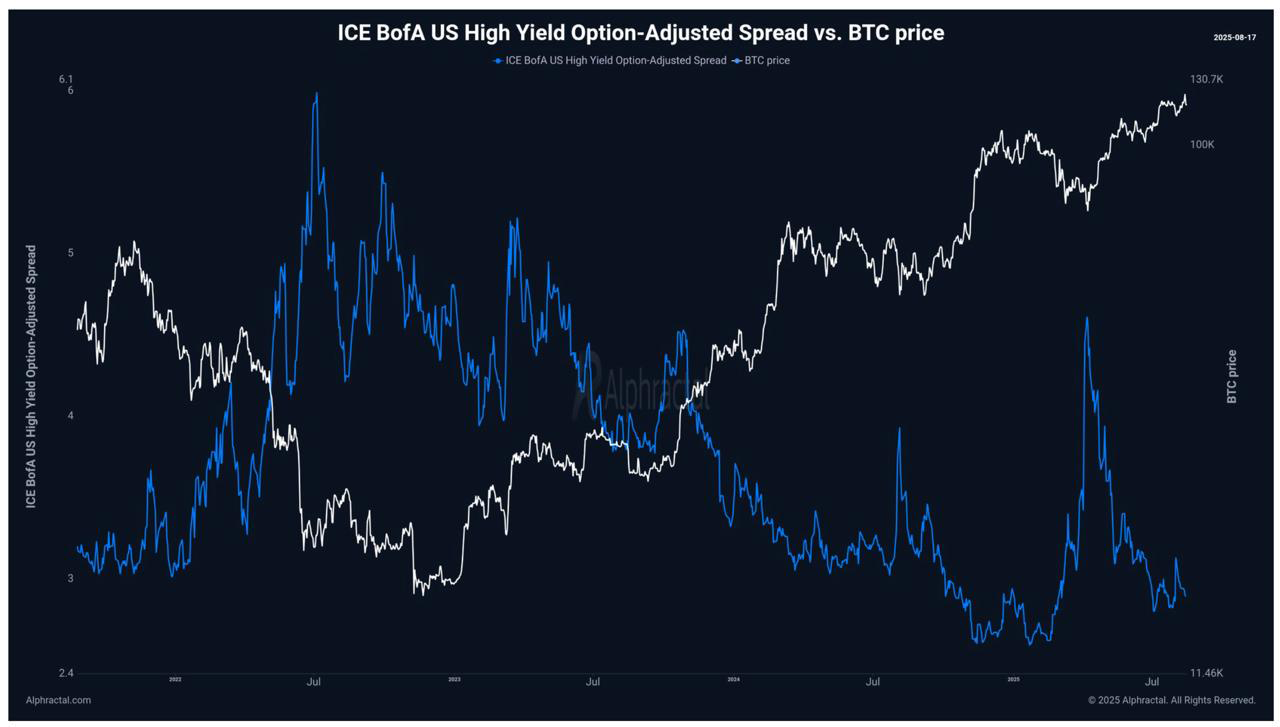
What Are High Yield Spreads?
High yield (HY) credit spreads measure the difference between the yield on "junk" bonds.. debt issued by companies with below-investment-grade credit ratings.. and the yield on US Treasuries. This gap is the fear premium: the extra compensation investors demand for lending to companies that might default.
Tight spreads (~300–350 basis points) mean investors are comfortable. They're willing to lend to risky companies for only a small premium over Treasuries. This signals confidence in the economy, low default expectations, and risk-on positioning.
Wide spreads (>500 basis points) mean investors are scared. They're demanding a big premium because they expect defaults to rise. This signals economic stress, deteriorating credit conditions, and risk-off positioning.
| Event | HY Spread Before | HY Spread Peak | SPX Drawdown | BTC Drawdown |
|---|---|---|---|---|
| GFC (2008) | ~300 bps | ~2,000 bps | -56% | N/A |
| COVID (2020) | ~350 bps | ~1,100 bps | -34% | -63% |
| 2022 Bear | ~300 bps | ~600 bps | -25% | -77% |
In every major risk-off event of the past two decades, HY spreads blew out before or simultaneously with the equity drawdown. Credit markets don't lie.. when institutional lenders start demanding higher compensation for risk, it's because they're seeing deterioration in the real economy before it shows up in stock prices or ISM data.
Why Credit Leads
There's a clear hierarchy in how risk-off events cascade through financial markets:
Credit moves first. Bond investors are the most sophisticated, most risk-averse participants in the market. They're lending real money with real default risk. When they start pulling back, it's because they're seeing something.. deteriorating balance sheets, tightening funding conditions, rising default probabilities.. that equity investors haven't priced yet.
Equities follow. Equity markets are more speculative, more driven by narrative and sentiment. They can ignore credit deterioration for weeks or months.. "the market can stay irrational longer than you can stay solvent." But eventually, the credit signal proves right, and equities reprice.
Bitcoin follows last. As the highest-beta, most speculative liquid asset, Bitcoin tends to be the last domino. When credit stress finally forces equity selling, the resulting risk-off cascade hits Bitcoin hardest. This lag creates both risk and opportunity.. you can see the stress building in credit markets before it reaches Bitcoin.
Credit stress builds → HY spreads widen → Equity volatility rises → Risk-off selling begins → Bitcoin sells off
By the time Bitcoin is crashing, credit was already sending a warning. The regime engine catches this because HY spreads are one of its 20+ voting assets.. their widening shifts votes toward Inflation and Deflation, triggering the risk-off signal before the equity waterfall.
HY Spreads and Bitcoin
The relationship between HY spreads and Bitcoin is straightforward: tightening spreads are bullish, widening spreads are bearish. The nuance is in the context.
Tightening spreads + Goldilocks regime = highest conviction risk-on. When credit markets are calm, the macro regime is favorable, and global M2 is expanding, you have the ideal environment for a Bitcoin trend trade. All three macro forces (credit, regime, liquidity) are aligned. This is when the signal system at full allocation is most likely to produce its biggest winners.
Ultra-tight spreads = fragility. This is the counterintuitive part. When HY spreads compress to historic tights.. like late 2024 / early 2025 when they hit ~300 bps.. it doesn't mean everything is safe. It means everyone is positioned for calm. Low cash levels, tight IG spreads, high EPS percentile positioning, low cross-asset correlations. The market is a dry powder keg. It's not a timing signal.. you can't predict when the spark comes.. but it tells you the fire will spread fast when it does.
Tight spreads feel safe. They are not. They are the market's way of telling you that nobody is hedged. When a shock arrives (and one always does), the repricing is violent because everyone runs for the exit simultaneously. The 2022 cycle is the perfect example: spreads were historically tight in late 2021, and the subsequent widening coincided with Bitcoin's -77% drawdown.
HY in the Regime Engine
High yield spreads are one of the 20+ assets in the Macro Regime Engine. Here's how they're implemented:
| Parameter | Value | Why |
|---|---|---|
| Momentum Window | Long | Multi-month effective window.. captures slow-building credit trends |
| Volatility Window | Moderate | Moderate smoothing.. credit vol is lower than equity vol |
| Threshold | Low | Low threshold.. even small moves in credit are significant |
| Timeframe | 5-day (weekly) | Macro instrument.. updates on weekly candles, not daily noise |
| Inversion | Yes | Falling spreads = bullish for risk (the engine flips the sign) |
The inversion is key. Raw HY spread data goes up when spreads widen (stress). But widening spreads are bearish for risk. The engine inverts the data so that "bullish HY" means spreads are tightening (risk-on) and "bearish HY" means spreads are widening (risk-off). This ensures HY's volatility-adjusted score correctly maps to the voting matrix.
When HY is bullish (tightening), it casts votes for Goldilocks and Reflation.. both growth-positive, risk-on regimes. When HY is bearish (widening), it votes for Inflation and Deflation.. both risk-off regimes.
The low threshold (0.10) means the engine is sensitive to credit moves. A small-but-sustained widening in HY spreads.. even before it becomes front-page news.. will start shifting votes toward risk-off. Combined with the other 20+ assets' votes, this early credit signal can flip the regime classification before the equity waterfall begins. That's the structural edge of breadth-based regime investing.
The Canary Doesn't Lie
"Bond investors lend real money with real default risk. When they're scared, you should be too."
HY spreads won't tell you exactly when Bitcoin will sell off. They won't give you a precise entry or exit. But they will tell you about the health of the risk environment with more honesty than any other single indicator. Tightening spreads = favorable terrain. Widening spreads = get defensive. Ultra-tight spreads = the terrain is deceptively calm.
In the DurdenBTC framework, HY spreads serve as one vote in the 20+ asset ensemble. Combined with M2 liquidity, ISM growth signals, the Fed's balance sheet, and 18 other cross-asset measurements, they contribute to a regime classification that has produced a 14.78 profit factor over 26 years.
The credit market is the most important market that most crypto traders never look at. Start looking. The weekly research includes current spread readings, and The Eighth Rule accounts for credit conditions through its macro context layer. For the risk management framework that ties it all together, start there.