What Is Macro Regime Investing?
Most trend-following systems ask a simple question: "Is this asset going up or down?" They slap a moving average on a chart and call it a strategy. When the market cooperates, it works. When it doesn't, they bleed to death by a thousand whipsaws.
Macro regime investing asks a fundamentally different question: "What is the global macroeconomic environment right now, and is it friendly to risk assets?"
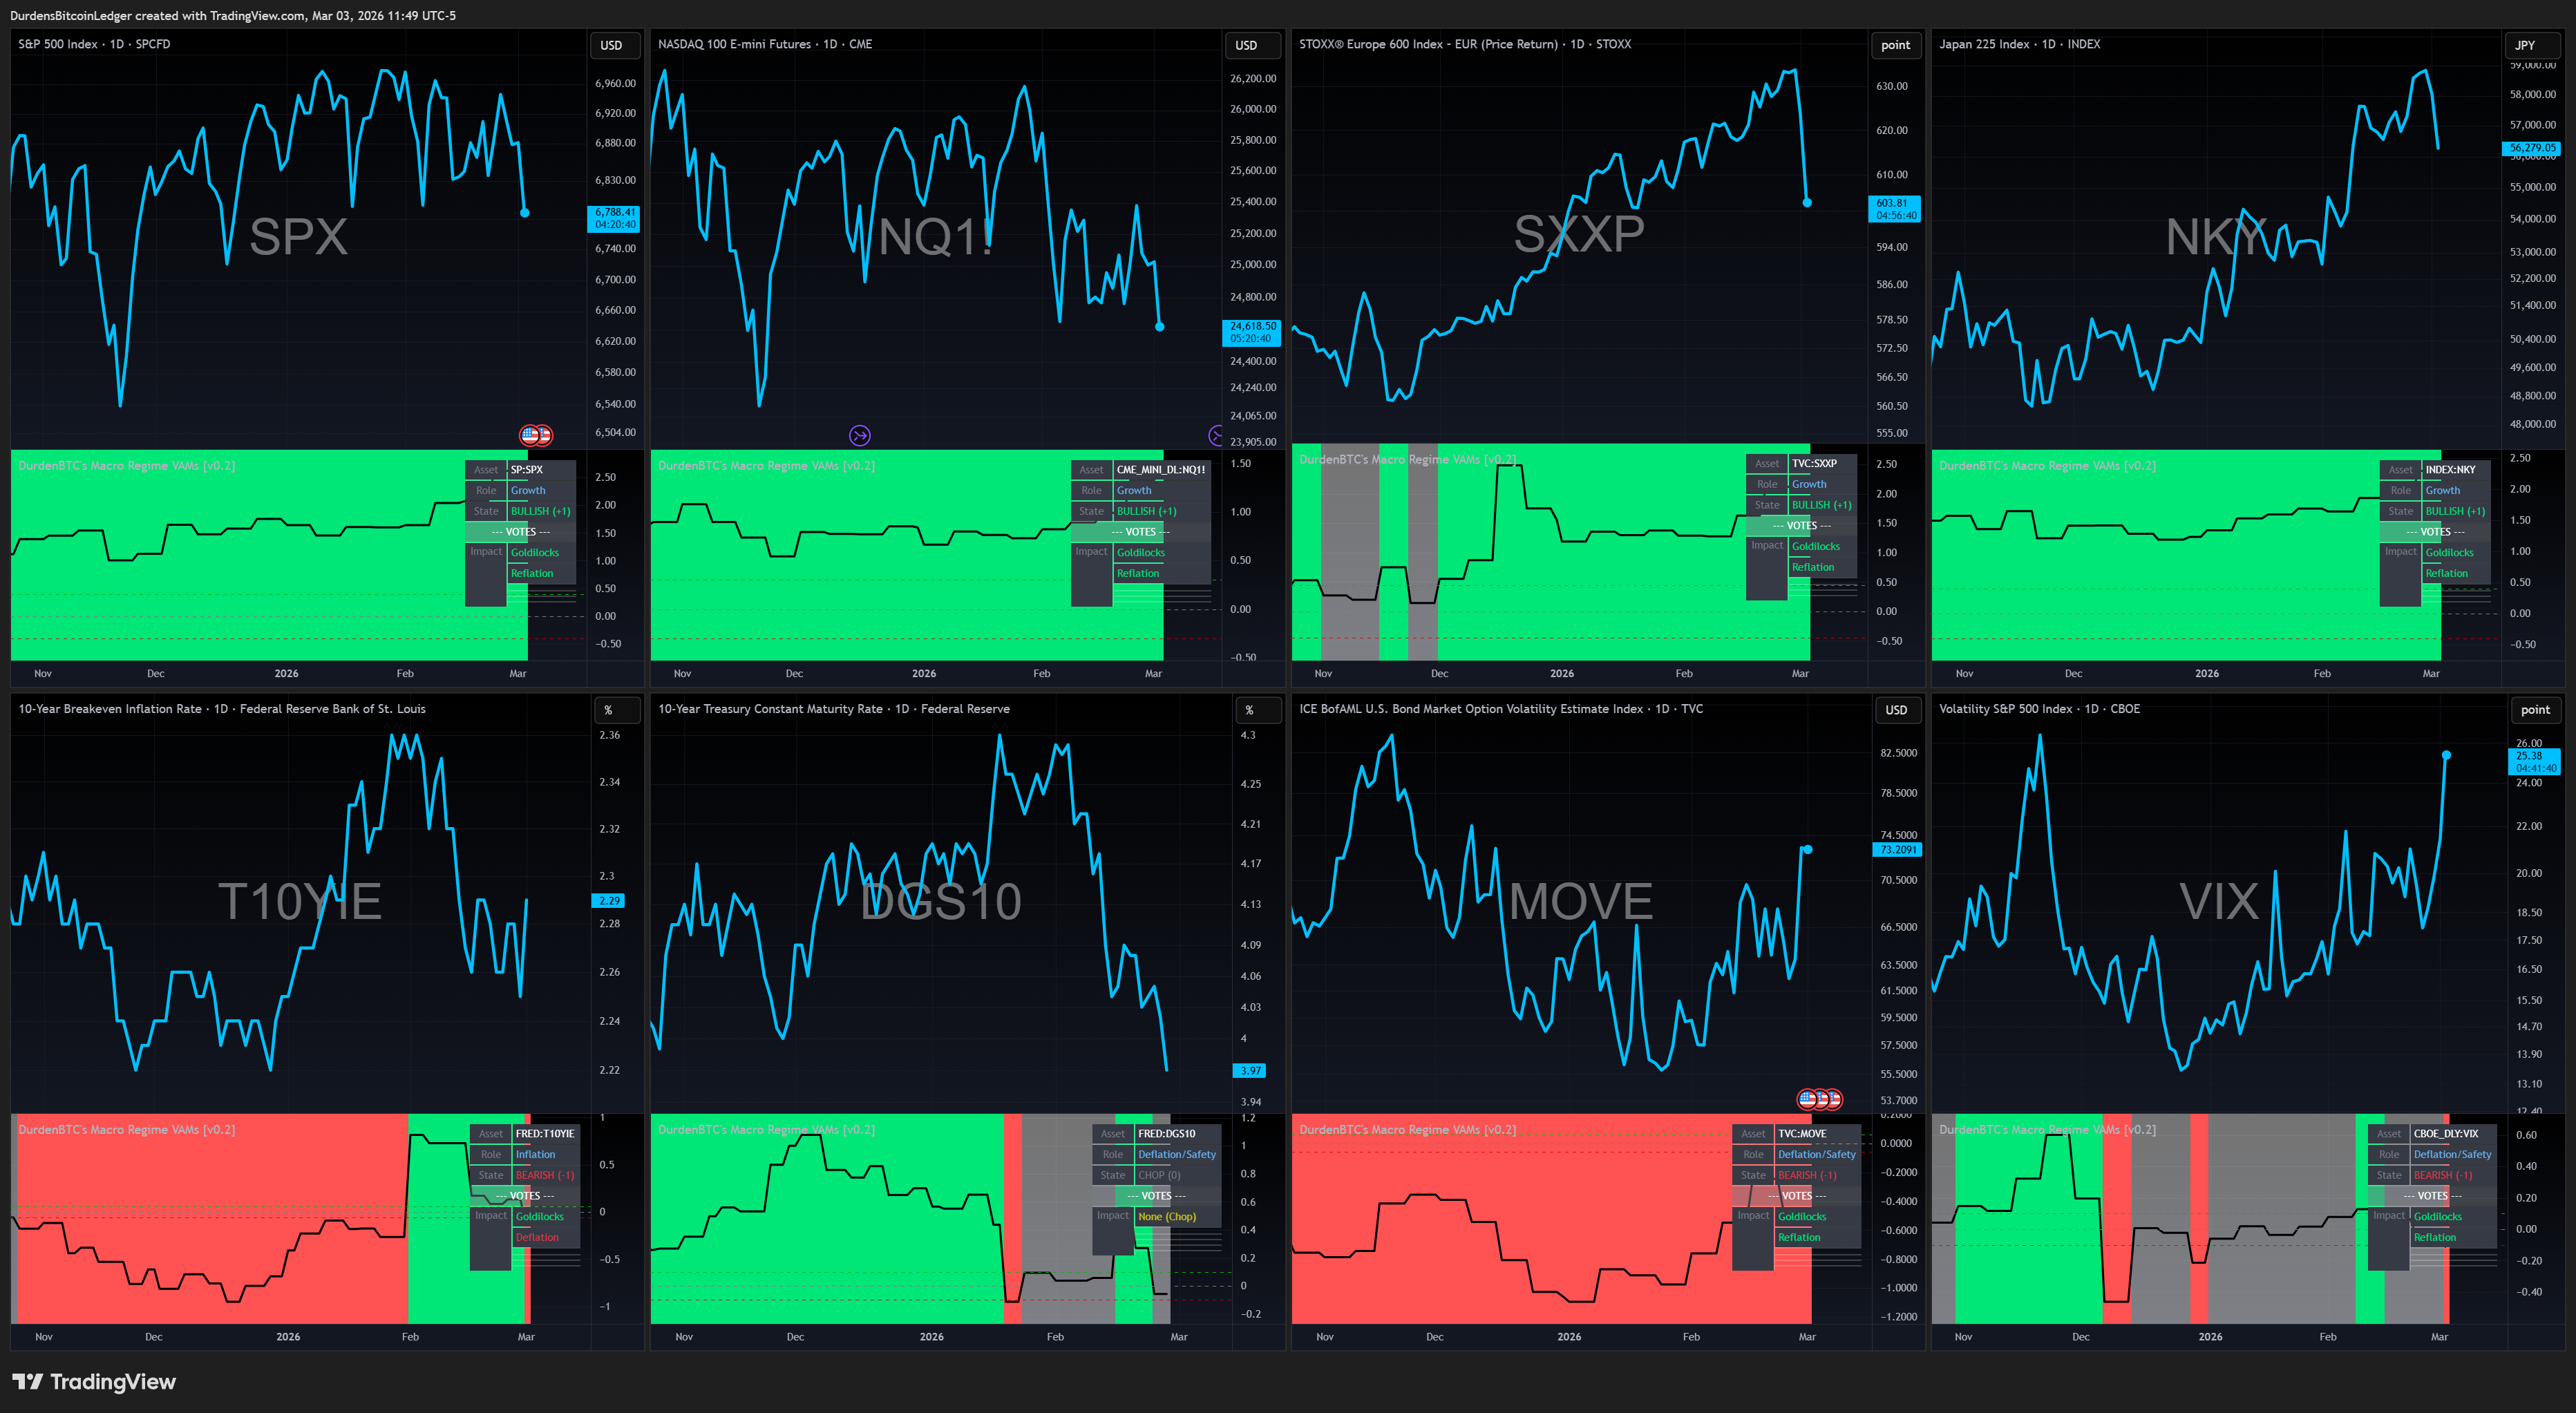
Instead of staring at one chart, the system polls 26 voters across equities, breakevens, the yield curve, FX, credit, and commodities.. essentially asking every major market on Earth to vote on what regime the global economy is in. Then it classifies that regime into one of four quadrants and makes a binary decision: be invested, or hold cash.
This distinction.. regime classification from cross-asset breadth versus technical trend-following on a single chart.. is why MRE v06 produces a 0.96 Sharpe with a −16.22% max drawdown over 23 years on SPY. Seven independent forward tests passed. Buy-and-hold's max drawdown across the same window: −56.47%.
Single-asset indicators measure price. Cross-asset regime systems measure the environment. Price tells you what happened. The environment tells you what's likely to happen next. One is a rear-view mirror. The other is a weather forecast. You want the forecast.
The philosophical foundation is simple: markets don't move in isolation. When the S&P 500 is rallying, there's usually a reason.. credit spreads are tightening, the dollar is weakening, volatility is compressing, growth currencies are strengthening. All of these signals carry information. A regime system aggregates that information into a single, actionable classification. For a deeper dive on why avoiding drawdowns matters more than capturing upside, read the drawdown management guide.
Goldilocks, Reflation, Inflation, Deflation
The system classifies the world into four macroeconomic quadrants. This framework is rooted in the same growth/inflation matrix used by institutional macro investors.. Bridgewater, GMO, and similar. But rather than evaluating growth and inflation directly from economic data (which is lagged and revised), the engine infers the regime from what assets are actually doing.
Markets are forward-looking; economic data is backward-looking. The system sides with markets.
| Regime | Growth | Inflation | Equities | What Happens |
|---|---|---|---|---|
| Goldilocks | ↑ | ↓ | Best | Economy growing, inflation contained, central banks accommodative. Equities rally, vol is low, spreads tight. |
| Reflation | ↑ | ↑ | Good | Growth and prices rising. Commodities rally, breakevens up. Early-cycle recovery.. everything goes up. |
| Inflation | ↓ | ↑ | Bad | Stagflation territory. Rising prices, slowing growth. Fed tightening. Equities squeezed from both sides. |
| Deflation | ↓ | ↓ | Bad | Recession territory. Flight to safety. Dollar strengthens, yields fall, VIX spikes, credit blows out. |
Goldilocks and Reflation are risk-on. The system is fully invested. Inflation and Deflation are risk-off. The system holds cash. No discretion. No "nibbling." No hope trades. The regime decides, and you execute. That's the core thesis in action.. survival is alpha.
Each regime isn't determined by a single indicator. It emerges from consensus across all 26 voters. SPX bullish + Oil bearish + VIX bearish = Goldilocks. SPX bullish + Oil bullish + breakevens rising = Reflation. The regime emerges from the combination of votes, not from any single asset.
How the Voting System Works
Every asset in the system gets scored by the same core algorithm: a proprietary volatility-adjusted scoring algorithm. It's a Sharpe-ratio-style z-score calculated per asset.
Each asset gets a volatility-adjusted momentum z-score.. a Sharpe-ratio-style calculation that normalizes raw momentum by realized volatility. The result is a dimensionless score that answers: "Is this asset's recent movement statistically significant relative to its current noise level?" Assets with scores above their threshold are bullish. Below: bearish. Between: chop (no vote).
The numerator is raw momentum.. how much has this moved? The denominator is realized volatility.. how noisy is this asset right now? The result is a dimensionless score that answers: "Is this asset's recent momentum statistically significant relative to its current noise level?"
Each asset is classified into one of three states: BULL (+1) when the score exceeds the threshold, BEAR (-1) when below the negative threshold, and CHOP (0) when between. Assets in CHOP don't vote at all.. sideways, ambiguous price action doesn't contaminate the signal. Only assets with statistically meaningful moves get a voice.
The Voting Matrix
| Asset Type | If BULLISH | If BEARISH |
|---|---|---|
| Growth (SPX, NDQ, BTC, IWM, etc.) | +1 Goldilocks, +1 Reflation | +1 Inflation, +1 Deflation |
| Inflation (Breakevens, Oil, DBC) | +1 Reflation, +1 Inflation | +1 Goldilocks, +1 Deflation |
| Safety (DXY, VIX, MOVE, Yields) | +1 Deflation, +1 Inflation | +1 Goldilocks, +1 Reflation |
Each asset votes into two buckets, not one. A single asset can't tell you whether you're in Goldilocks or Reflation.. only that you're in one of them. It takes the combination of votes across all asset classes to distinguish between regimes. The winning regime needs a minimum of 10 votes with at least a 1-vote lead. If no regime meets this threshold, the system classifies the environment as Chop and stays flat.
Per-Asset Calibration
Each asset has its own momentum length, volatility length, and threshold calibrated to its specific characteristics. Equities have higher thresholds because they're volatile.. you need a bigger move to be meaningful. FX thresholds are lower because currencies move in smaller increments. Bitcoin requires the most evidence before it gets a vote.. the noisiest asset gets the strictest filter. The exact calibrations are proprietary, but the principle is universal: every asset's bar for "significance" is matched to its own volatility profile.
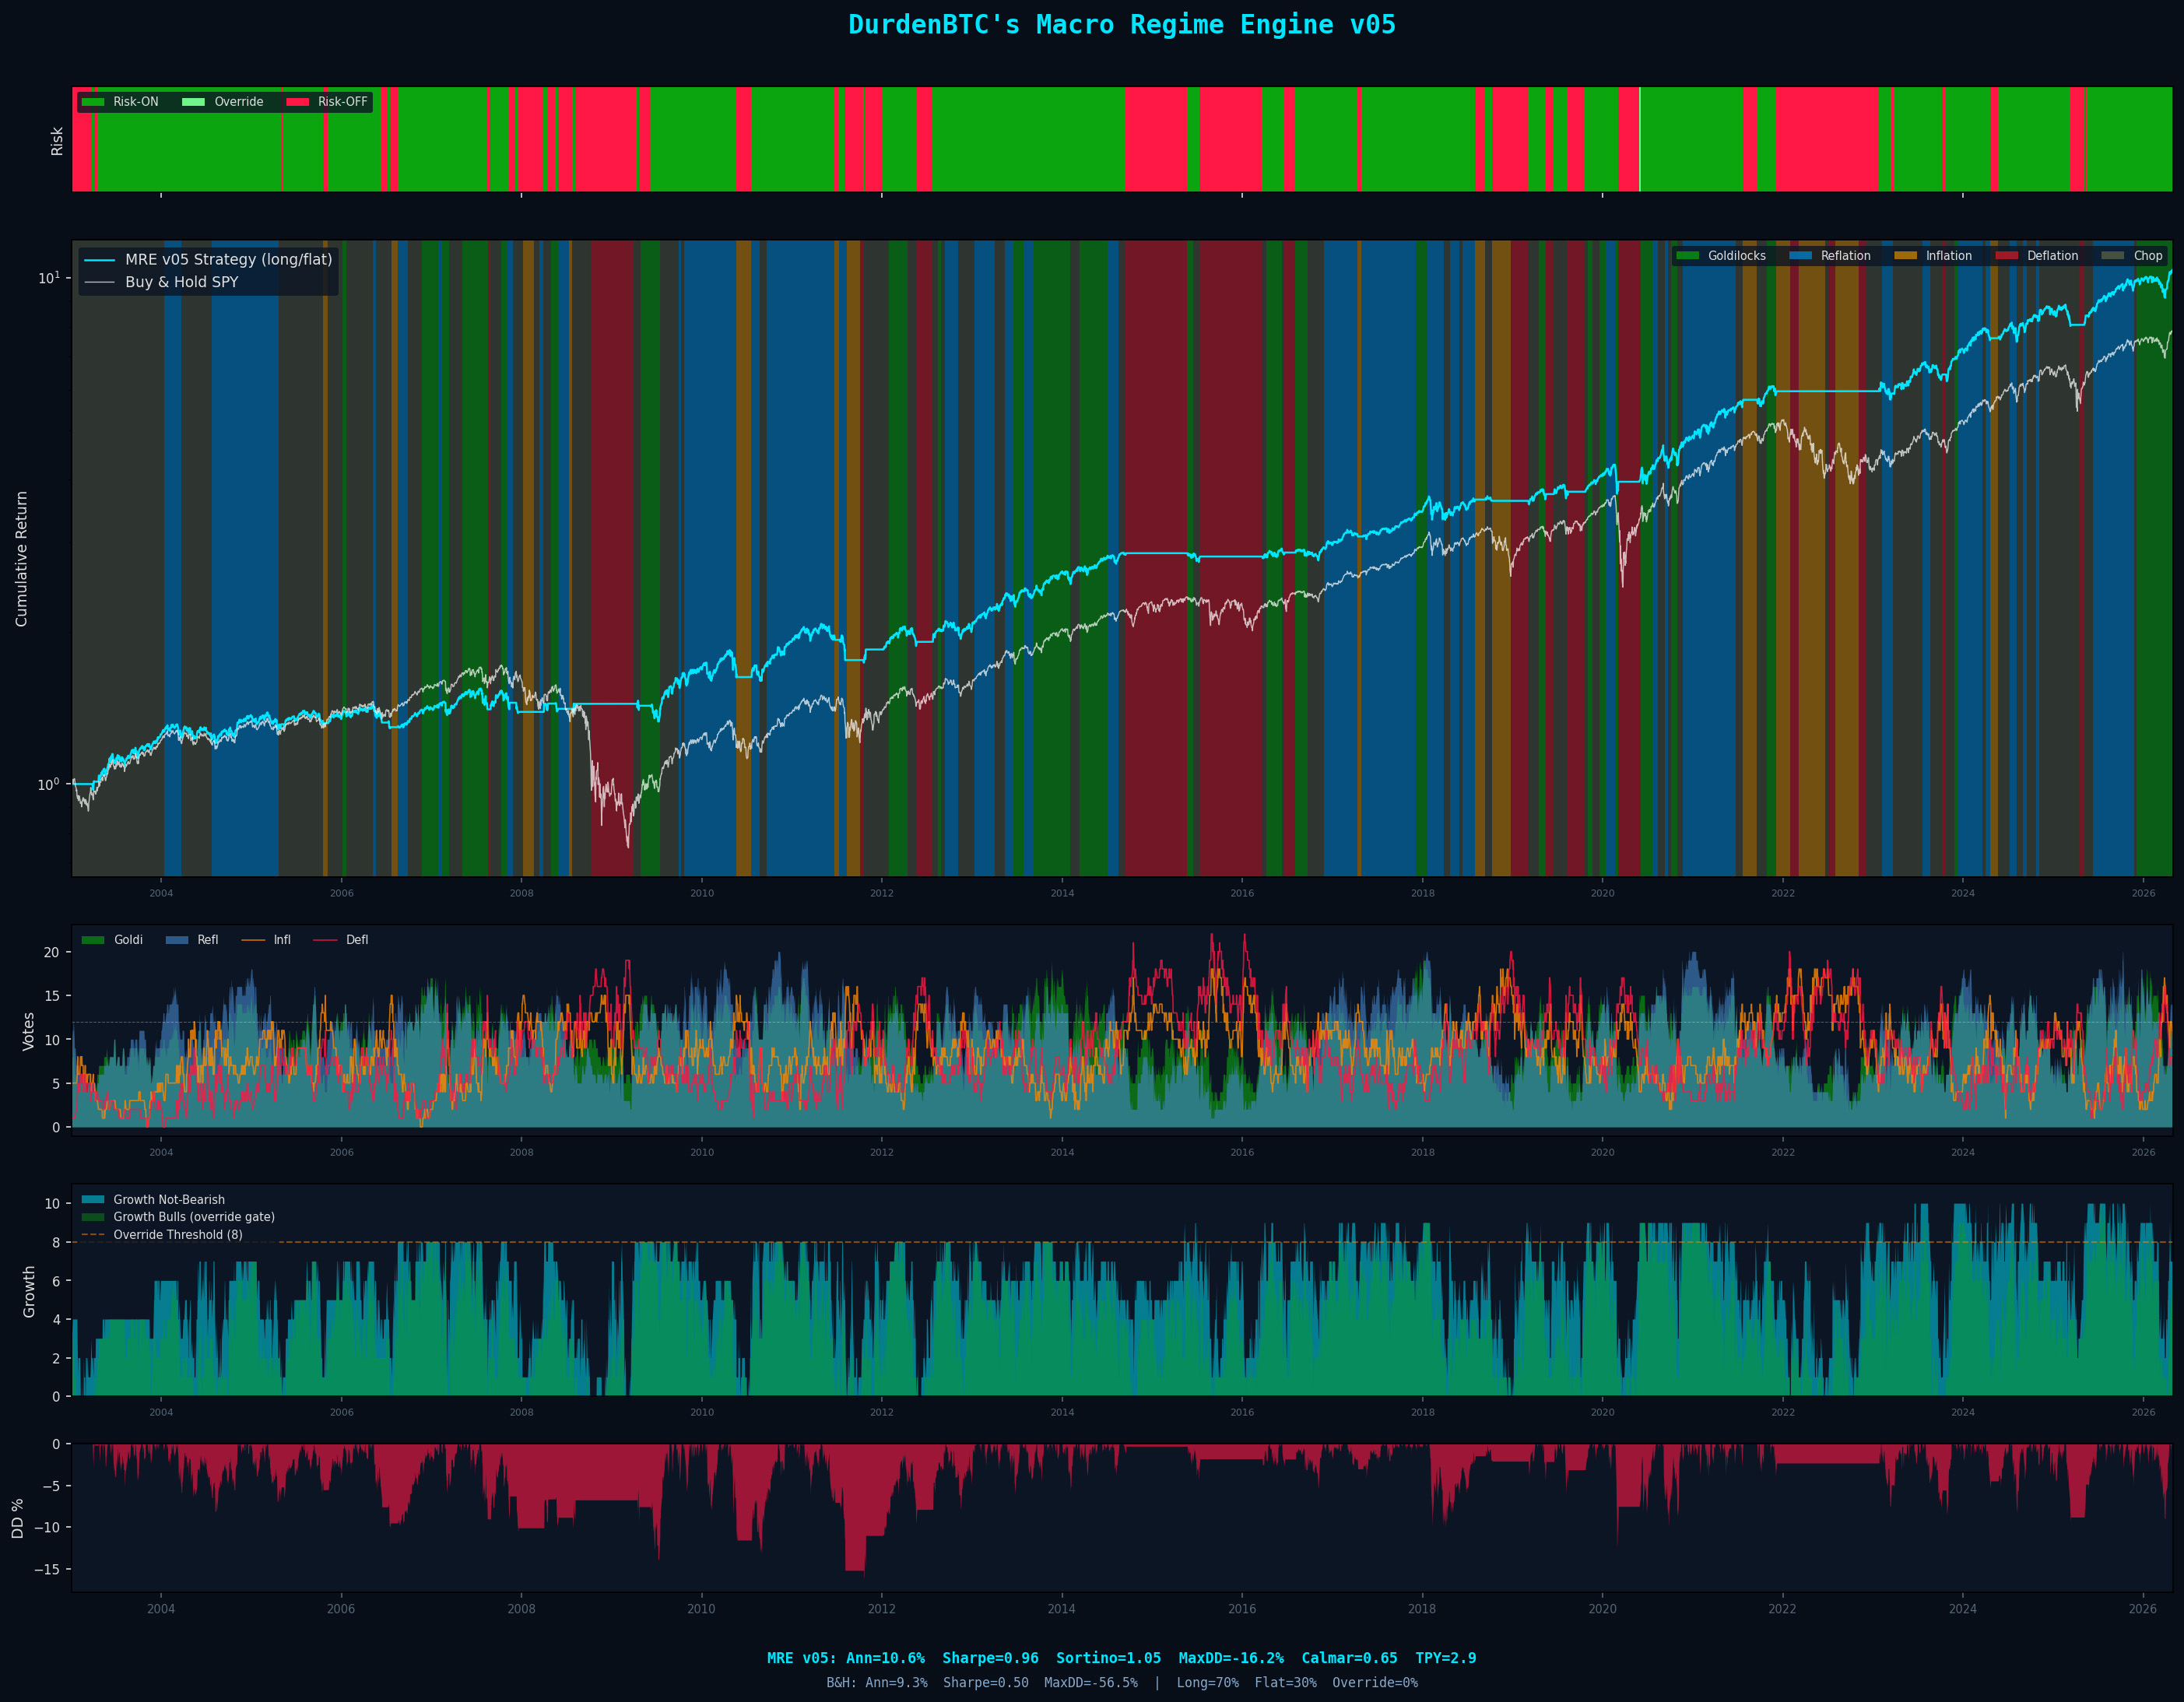
23 Years of Performance
MRE v06: +925.8% · CAGR: 10.52% · Sharpe: 0.96 · Max DD: −16.22%
Buy & Hold SPY: +679.4% · CAGR: 9.22% · Max DD: −56.47%
70.5% of trading days long. Seven independent forward tests, zero failures.
The engine didn't predict crashes. It measured that the macroeconomic environment had turned hostile.. credit spreads widening, volatility spiking, growth currencies collapsing, safety assets rallying.. and stepped aside before the waterfall phase.
| Crisis | Engine Action | SPY Drawdown | Engine Outperformance |
|---|---|---|---|
| GFC (2007–09) | Exited Dec 2007 | −56.47% | +44.5% relative |
| COVID (Feb 2020) | Exited week of Feb 20 | −34% | +26.7% relative |
| 2022 Bear | Exited Nov 2021 | ~−25% | Avoided most |
| 2025 Tariff Wobble | Brief risk-off Q1 2025 | ~−15% | Re-engaged mid-year |
The engine beat buy-and-hold in 6 of 10 named crises across the 23-year window. The COVID exit on February 20, 2020.. the exact week before the crash.. wasn't luck. It was the result of 26 voters simultaneously signaling that the macro environment had flipped hostile. Breadth doesn't lie. For full per-test detail and the seven-test forward-test suite, see the dedicated MRE v06 page and the forward-testing page.
Why Breadth Beats Prediction
The single most important reason the system works: it's not one indicator on one asset. It's 26 independent measurements of the global macroeconomic environment.
Any single asset can give a false signal. The S&P can rally on a short squeeze while credit markets are screaming danger. Oil can spike on a geopolitical event that has nothing to do with the underlying growth trend. The VIX can be suppressed by options market structure even as fundamental risk is building.
But when you poll 26 voters across 6 asset classes, the noise cancels out. A false signal in equities gets contradicted by bonds. A commodity spike gets contextualized by the dollar and credit spreads. The regime that emerges from consensus across all these independent measurements is dramatically more reliable than any single signal.
"One signal can lie. Twenty-plus signals forming consensus is the closest thing to truth that markets offer."
This is why simple systems.. moving average crossovers, RSI, MACD.. underperform over full cycles. They're measuring one dimension of a multi-dimensional problem. The macro regime framework measures all the dimensions simultaneously and lets the data form its own conclusion.
Macro Regimes and Bitcoin
Bitcoin is the highest-beta liquidity asset in existence. When the macro regime is Goldilocks.. growth up, inflation down, central banks accommodative.. Bitcoin tends to deliver its most explosive moves. When the regime flips to Deflation, Bitcoin often falls faster and harder than equities.
MRE v06 was built for equities (SPY), but its regime classification is directly relevant to Bitcoin positioning. The engine tells you whether the global environment is friendly to risk. Arsenal BTC.. the Bitcoin-specific system.. uses its own independent signal stack (VAMS: a trend filter plus a three-layer volatility regime filter) for entry timing. The two systems are independent.. they can be used together (subscribers often do) or standalone.. but the macro regime context from MRE v06 is what determines conviction level on top of the Arsenal signal. Looking for the older, more aggressive Bitcoin alternative? See The 8th Rule (legacy).
The Deflation Risk-On Override
The most sophisticated piece of the system handles a specific scenario: when macro data says "deflation" but equities are rallying anyway. This happens when markets front-run the Fed.. bad economic data means rate cuts are coming, and rate cuts are bullish. "Bad news is good news."
If regime == Inflation or Deflation:
If 8+ of 10 growth assets are BULL AND SPX == BULL:
→ "Deflation Risk-ON".. stay long.
This override captured late 2023 and early 2024 perfectly.. when the yield curve was inverted and recession fears were real, but equities rallied aggressively on Fed pivot pricing. A naive regime system would have been 100% cash during one of the best rallies in years. The override kept the system invested.
For Bitcoin specifically, this override context matters enormously. When the macro regime says Deflation but the override fires, Bitcoin is typically in "liquidity anticipation" mode.. rallying on the expectation of future easing. These can be some of the fastest Bitcoin moves. Combining regime context with Arsenal BTC's signal stack gives you both the macro backdrop and the precise entry timing.
Regime First, Then Execute
The entire framework reduces to a simple hierarchy:
"Identify the regime. Respect the regime. Execute within the regime. Never fight the macro tide."
MRE v06’s +925.8% return with a 0.96 Sharpe and −16.22% max drawdown over 23 years isn't the result of predicting crashes. It's the result of measuring the environment and making a binary decision based on 26 independent confirmations. The edge isn't prediction.. it's measurement. Seven independent forward tests passed; that result isn't curve-fit.
This guide is the foundation. From here, explore how global M2 liquidity drives Bitcoin, how Arsenal BTC's signal stack works, or how the full multi-asset portfolio comes together. The live MRE v06 page shows the system's real-time state with full backtest transparency, and the forward-testing page documents every test that's been run.
If you want to go deeper on the mathematical foundation.. why avoiding drawdowns beats capturing upside.. start with The Thesis. Everything else builds from there.
Live Charts
Free macro regime updates, strategy breakdowns & thesis posts.
Sources
Primary Data
- FRED — S&P 500 (SP500)
- FRED — 10-Year Treasury Constant Maturity Rate (DGS10)
- FRED — High-Yield Option-Adjusted Spread (BAMLH0A0HYM2)
- FRED — Trade-Weighted Dollar Index (DTWEXBGS)
- FRED — 5-Year, 5-Year Forward Inflation Expectation (T5YIFR)
- NBER — US Business Cycle Reference Dates
- DurdenBTC — Macro Regime Engine (MRE v06) methodology
- DurdenBTC — Forward-testing methodology + results
Academic Foundations
- Ang & Bekaert (2002) — International Asset Allocation With Regime Shifts. Review of Financial Studies.
- Hamilton (1989) — A New Approach to the Economic Analysis of Nonstationary Time Series and the Business Cycle. Econometrica.
- Stock & Watson (1989) — New Indexes of Coincident and Leading Economic Indicators. NBER Macroeconomics Annual, Volume 4.
Full academic bibliography — DurdenBTC Academic Foundations →