Two States. That's It.
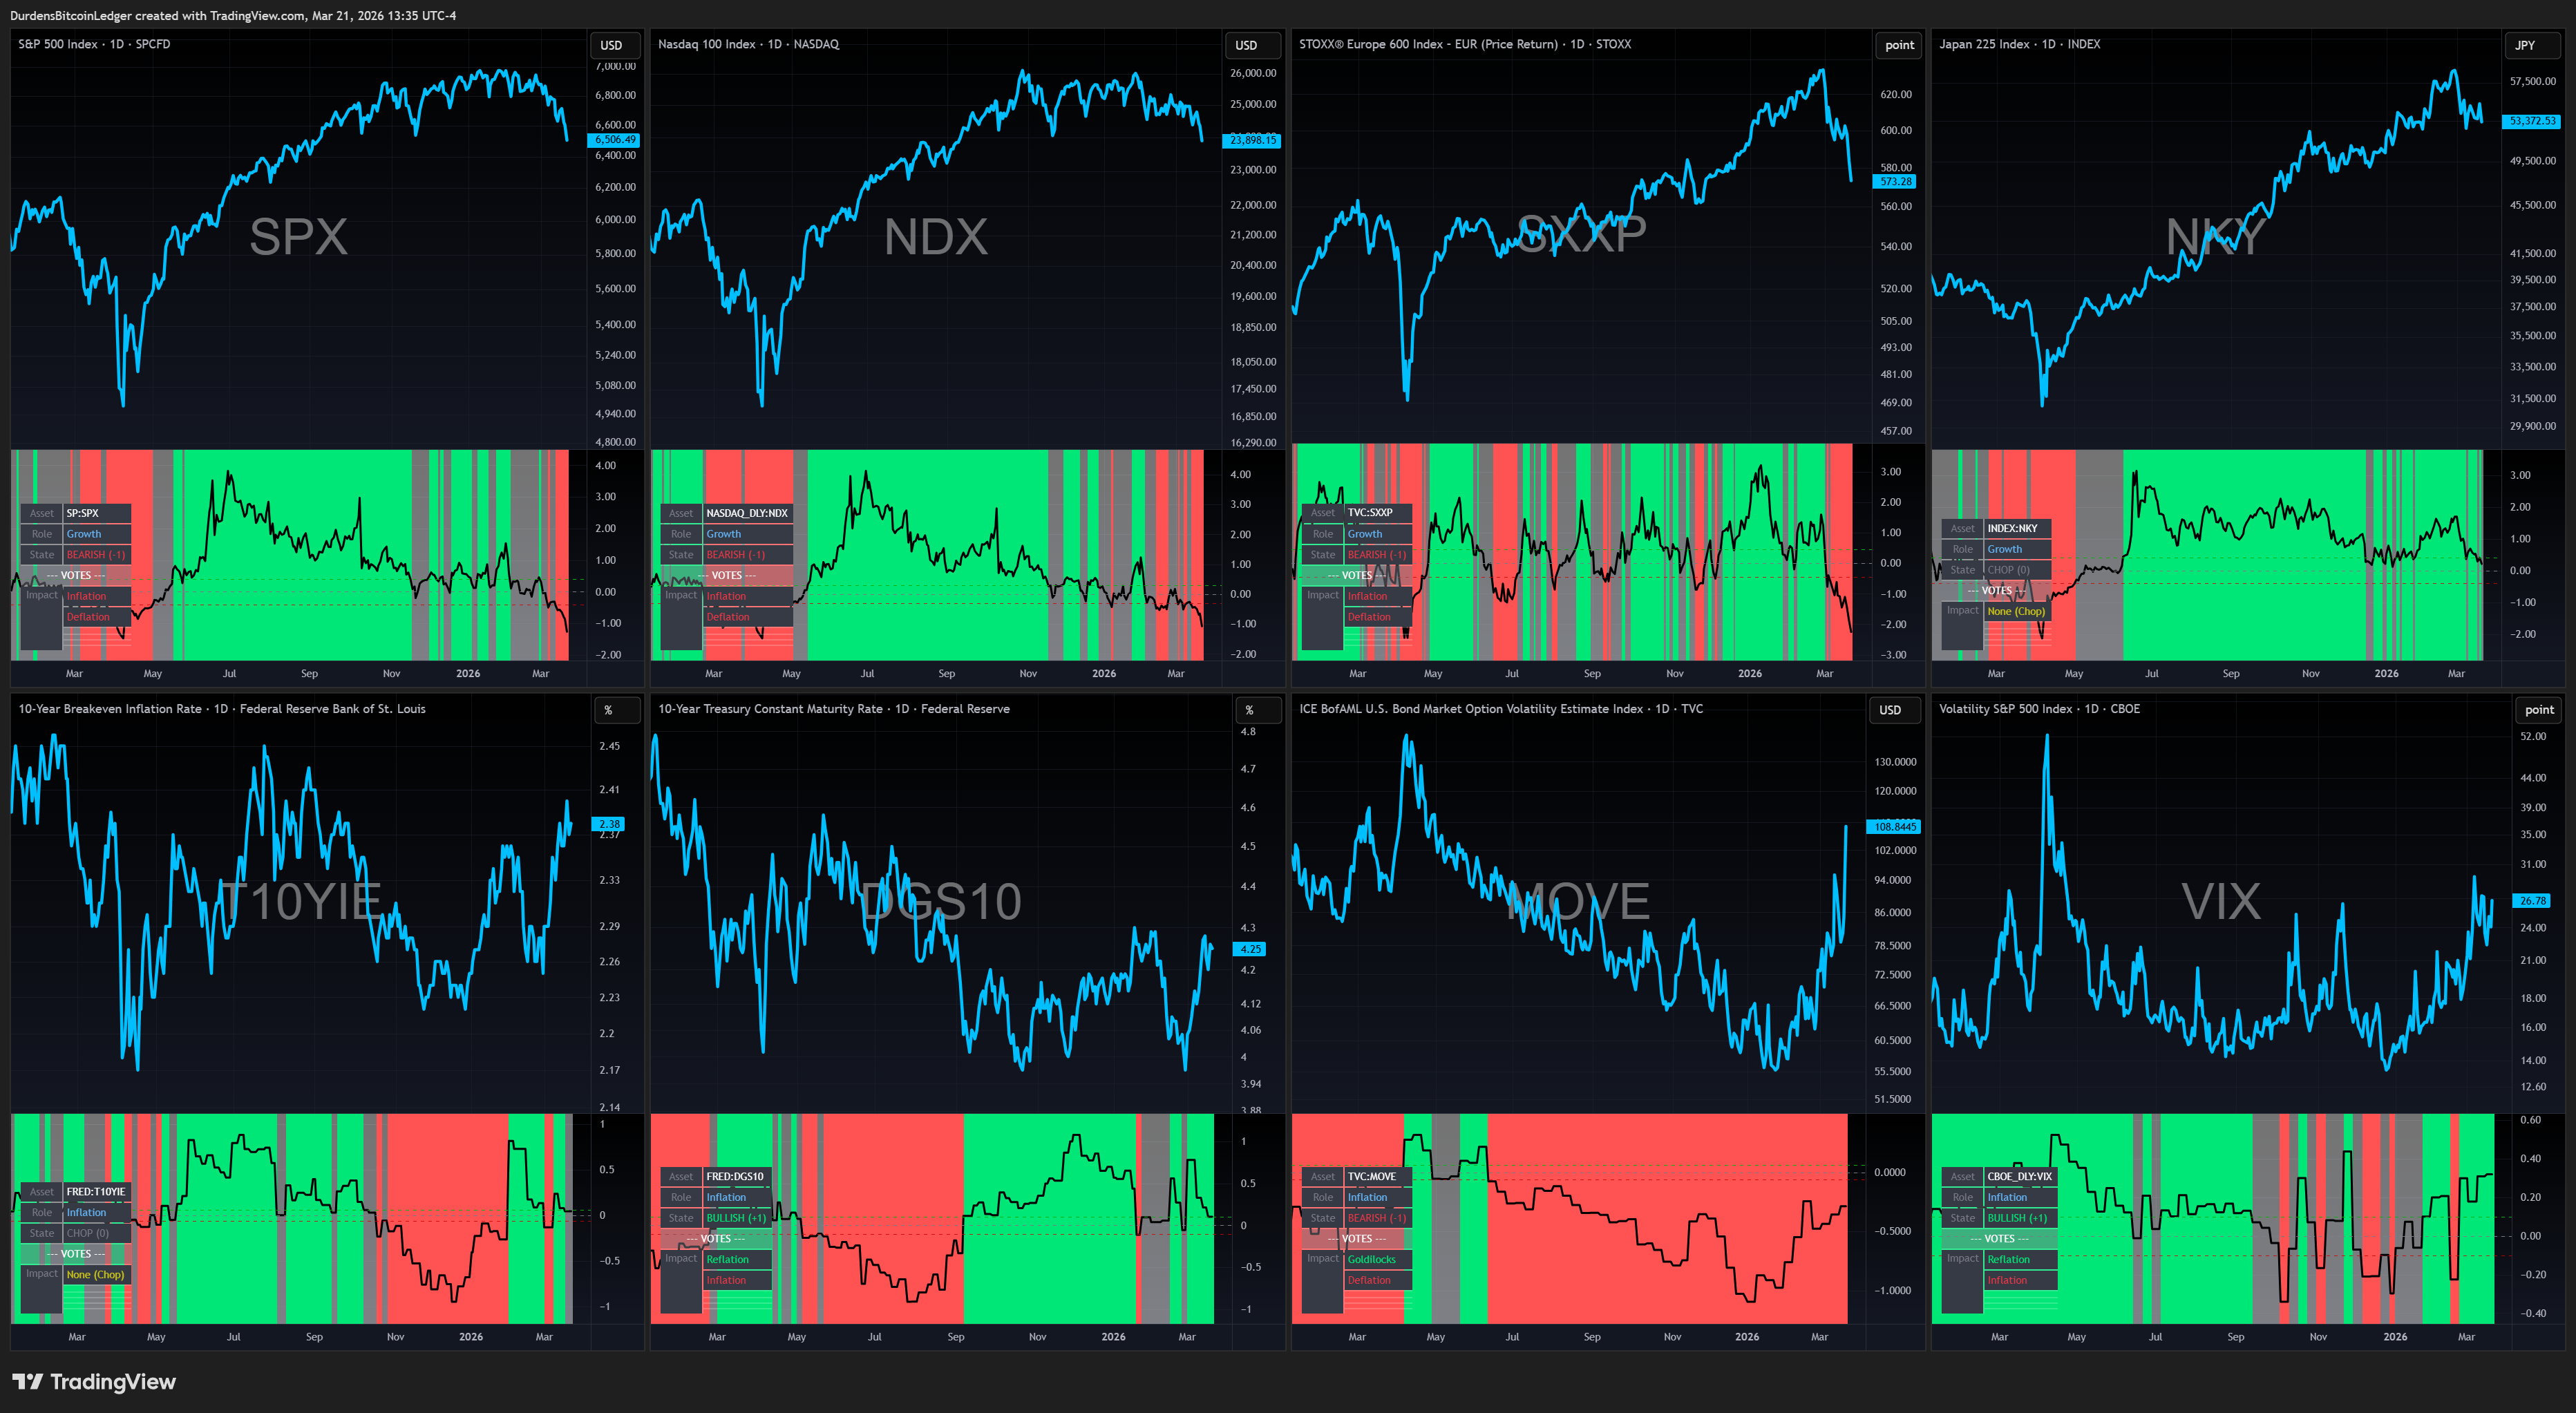
MRE v06 classifies today’s global macroeconomic environment into one of four regimes.. Goldilocks, Reflation, Inflation, or Deflation.. and condenses that classification into a single decision: RISK-ON (own SPY) or RISK-OFF (hold cash). The classification draws on 26 independent voters covering equities, commodities, breakevens, FX, the yield curve, and credit. The decision is published once per day, before markets open.
This page explains what’s under the hood.. enough that you can decide whether to trust the signal.. without giving away how it’s built. The engine is proprietary. I do publish the indicator output daily but I don’t share the code. I’m also not going to ask you to trust a black box on faith.
These four regimes are the same growth/inflation quadrant the largest institutional allocators in the world use to size risk. The difference is that MRE v06 measures it quantitatively, in real time, across 26 voters.. instead of reading press releases and making a discretionary call.

The Thesis, Not the Code
MRE v06 doesn’t look at a single chart. It doesn’t use a moving-average crossover on the S&P 500. It doesn’t care about RSI, MACD, or any single-asset technical applied to the index it’s deciding to own.
Instead, it listens to the entire global financial system, then runs the consensus through a five-stage pipeline.
When global equities rally, risk currencies strengthen, breakevens expand, credit spreads tighten, and the curve steepens all at the same time.. that’s not a coincidence. That’s 26 independent markets all saying “the macro environment is favorable to risk.”
Stage 1 reads the votes. Stage 2 classifies the regime. Stage 3 confirms the change isn’t noise. Stage 4 catches the edge cases (the “bad news is good news” rallies). Stage 5 keeps a final risk-off veto in reserve. Below: each stage in plain English.
26 Voters Across Four Asset Categories
Roughly 10 growth voters (equity indices, growth-sensitive commodities), ~7 inflation voters (breakevens, oil, copper, silver), ~5 duration voters (2y / 10y yields, the curve), and ~4 FX voters (DXY plus the major risk crosses). Each voter computes a volatility-adjusted trend signal and casts a vote for one of the four regimes. Volatility-adjusted means a 1% move in DXY and a 5% move in copper carry roughly equal weight.. no single voter can dominate by virtue of being a more volatile asset.
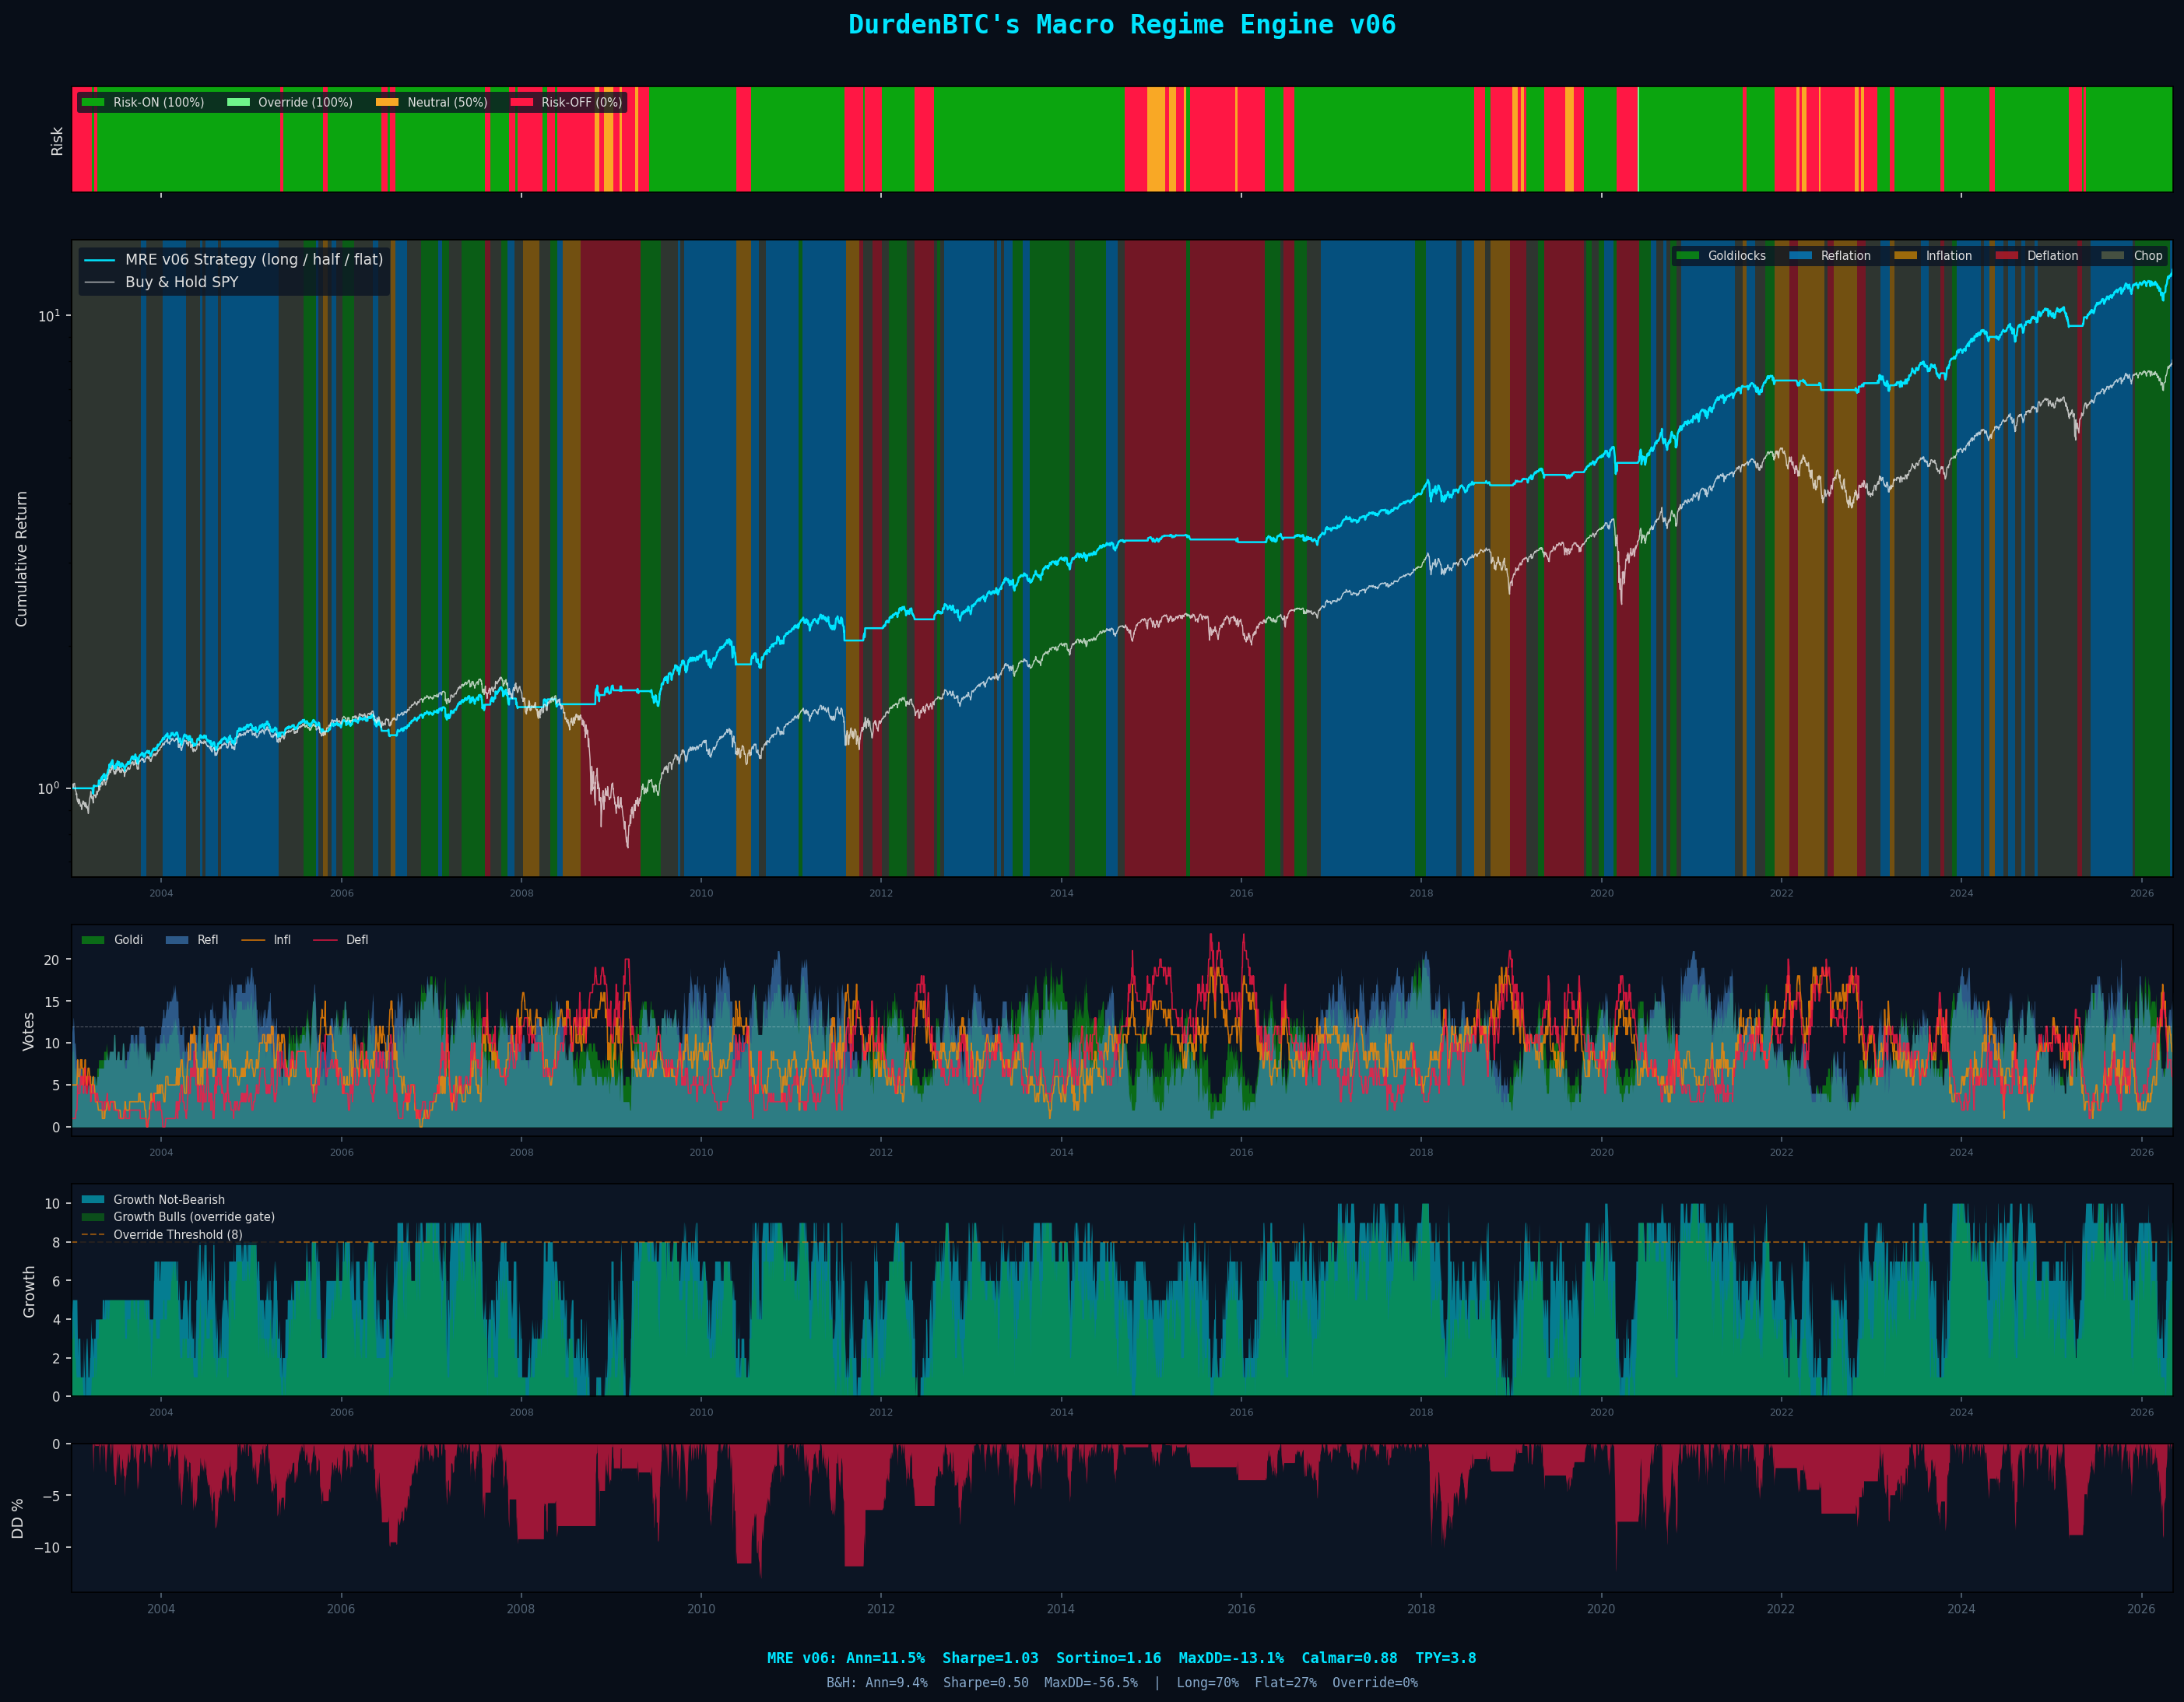
4 Regimes (Plus a 5th “Chop” State)
Goldilocks = growth up, inflation down. Reflation = growth up, inflation up. Inflation = growth down, inflation up. Deflation = growth down, inflation down. When voters disagree enough that no regime clears the conviction floor, the engine reports a fifth “Chop” state and stays in the last confirmed regime. This is by design.. it’s how the system avoids whipsaw on indecisive days.
Symmetric Hysteresis (7 Bars Each Way)
A regime change requires seven consecutive bars of evidence before it’s confirmed on tape.. both when going risk-on AND when going risk-off. Earlier versions used asymmetric hysteresis (faster to exit than enter); v06 is symmetric and cleaner. Symmetric hysteresis means the engine doesn’t panic-exit on a single bad week and doesn’t chase a one-week rally before the conditions confirm.
Growth Override + Min-Dwell
If macro voters say “deflation” but growth-sensitive markets are overwhelmingly bullish.. the “bad news is good news” case that captured the late-2023 / early-2024 rate-cut rally.. the override flips to risk-on. Once any regime is established, a min-dwell rule keeps the engine inside it for at least N days to prevent flip-flop. The override and dwell rules together let the engine respect macro when it matters and ignore it when growth assets are calling the bluff.
Arsenal SPY Veto (Final Layer)
Layered last and applied unconditionally: an independently-tuned Arsenal-style SPY engine acts as the final risk-off veto. If MRE’s macro stack says risk-on but the Arsenal SPY engine reads 0% (deep equity bear), the veto flips the published signal to risk-off. The veto bypasses dwell lock. The two engines are independently parameterised and validated.. they’re not the same signal applied twice. The Arsenal SPY veto is what catches the “macro looks fine but equities are imploding” case that broad-breadth voting can miss.
23 Years. 5,867 Trading Days.
MRE v06 has been backtested on SPY from 2003-01-02 through 2026-05-05.. 5,867 trading days, 23.34 years. That window includes the 2003 reflation, the 2008 GFC, the 2010 / 2011 / 2015 / 2016 corrections, the 2020 COVID crash, the 2022 rate-shock drawdown, the 2023 banking stress, and the 2024-2026 expansion. The system was held frozen for the full backtest.. no parameters were tuned to in-sample data.
| Metric | MRE v06 | Buy & Hold SPY |
|---|---|---|
| Annualised Return | +11.42% | +9.36% |
| Sharpe Ratio | 1.026 | 0.502 |
| Sortino Ratio | 1.155 | — |
| Max Drawdown | −13.09% | −56.47% |
| Calmar Ratio | 0.872 | — |
| Total Return | +1,159% | +713% |
| Trades per Year | 3.8 | — |
| Time Long | 70.5% of days | 100% |
| Voter Assets | 26 | — |
The headline number isn’t the +1,159%.. buy-and-hold gets +713% just by sitting in SPY. The headline number is the Sharpe gap (1.03 vs 0.50) and the drawdown gap (−13% vs −56%). MRE v06 captured most of the upside while spending material time in cash.. exactly where the avoided drawdowns come from.
Seven Tests. Zero Failures.
A backtest is necessary but not sufficient. The hard question isn’t “does the system look good on the data it was tuned on”.. it’s “does the system hold up against everything I can throw at it that isn’t the original training set.” MRE v06 ships with a seven-test suite that probes seven different robustness questions independently. Every test passed.
| Test | What It Asks | Result | Verdict |
|---|---|---|---|
| 1. OOS Walk-Forward | Does it hold up on data the engine has never seen? | Train Sharpe 0.754 → Test Sharpe 1.219. The test period’s Sharpe was 62% higher than the training period’s. | Pass |
| 2. Monte Carlo (Block) | Is the return sequence just lucky? | Actual Sharpe lands at the 50.9th percentile of 10,000 block-bootstraps. Median, not lucky. | Pass |
| 3. Regime & Crisis Stress | Does it behave sanely when markets break? | Beat B&H in 6 of 10 named crises (2008 GFC +44.5% relative outperformance, 2020 COVID +26.7%). | Pass |
| 4. Parameter Sensitivity | Does it collapse if a knob is one step off? | ±1 step from default retains 96.1%+ of baseline Sharpe across every parameter probed. | Pass |
| 5. New Input Impact | Are we missing any high-impact signals? | No candidate input (DFII10, IG_OAS, T10Y3M) improves the composite score meaningfully. | Pass |
| 6. Synthetic Price (SPS) | Would it work on a statistically-similar but different SPY history? | MODE A (block-bootstrap) p5 Sharpe +0.088; MODE B (Gaussian GBM) p5 Sharpe +0.069. | Pass |
| 7. Rolling OOS (1y & 3y) | Is performance concentrated in a few big years? | 16 of 21 rolling years (76%) post a positive Sharpe; zero catastrophic years; 3-year rolling median Sharpe of 1.00. | Pass |
The test that matters most for credibility is Test 1 (OOS walk-forward). I split the data in two: the engine was tuned on 2003-2015 and tested on 2016-2026. If the parameters were curve-fit to history, you’d expect the test period’s Sharpe to collapse. It didn’t.. it improved by 62%. The frozen v06 parameters handled the COVID crash, the 2022 rate shock, and the 2023 banking stress better than they handled the relatively-calm 2003-2015 training era.
Full per-test detail and the underlying methodology lives on the forward-testing page.
Drawdown Avoidance Is the Edge
MRE v06 doesn’t need to outperform buy-and-hold on every up cycle. It needs to dodge the catastrophic drawdowns that destroy compounding. If you hold through a 56% drawdown, you need a 127% gain just to get back to even. If you hold through −13% (MRE v06’s worst), you need 15% to recover. The engine enters each new bull cycle compounding from near its peak instead of digging out of a hole.. that asymmetry is most of the edge.
Each major exit happened before the worst of the drawdown.. not during it, not after it. That’s not luck. It’s what happens when the signal is driven by cross-asset breadth: macro deterioration shows up across markets simultaneously, before the equity waterfall begins. The seven-bar hysteresis means the engine waits for confirmation, but breadth confirmation arrives well before single-asset technicals do.
The Honest Answer
Breadth Is Hard to Fake
A single stock can be manipulated. A single index can be propped up. But the simultaneous behaviour of 26 voters across equities, breakevens, FX, the curve, and credit is real. It takes a genuine macroeconomic shift to flip 26 markets at once, and that’s exactly the moment when an exit is most valuable.
Losses Are Shallow
The largest single drawdown in 23 years is −13.09%. The reason is structural, not lucky: the engine exits on confirmed regime breaks, not on stop-outs. There’s no “wait for the bottom to be in” logic. When breadth flips, the engine flips. Losses don’t have time to compound.
Drawdown Avoidance Compounds
The Sharpe gap (1.03 vs 0.50) is more important than the return gap. A higher Sharpe means you can size the same returns with less psychological tax. The engine spent roughly 30% of trading days in cash.. that 30% is where the −56% buy-and-hold drawdowns happened.
Holdouts Are Long, Exits Are Decisive
Trades per year: 3.8. The engine commits to a regime once it’s confirmed and stays committed until breadth materially deteriorates. It doesn’t whipsaw. The hysteresis isn’t a bug.. it’s the feature that lets winners run for months while still cutting losers in days.
Read This
I’d rather you know the failure modes up front than discover them yourself.
It identifies that macro has turned hostile and steps aside. There’s a difference. The system didn’t “call” COVID.. it measured that cross-asset breadth deteriorated in the third week of February 2020 and exited. The crash happened after the exit. The engine responds to the present, not the future.
The seven-bar hysteresis that prevents whipsaw also delays re-entry. A fast V-shaped recovery (think: the late-March 2020 bottom) means the engine misses the first few weeks of upside while it waits for breadth to confirm. The crisis-stress test (Test 3) makes this visible: the engine wins on extended drawdowns and loses on one-week vol shocks.
Fewer than four trades per year sounds modest because it is. If you’re looking for daily / weekly action, this is the wrong tool. MRE v06 changes its mind a few times per year, sometimes only once, and the value is precisely in not changing more often than the macro changes.
The backtest assumes daily-close execution at the published price. Slippage, gap risk, and the messy reality of trading around holidays will introduce friction the backtest doesn’t see. Treat the published numbers as the ceiling, not the floor.
What Subscribers Receive
The Live MRE v06 Signal
Risk-on or risk-off, refreshed daily before market open. Plus the four-regime classification (Goldilocks / Reflation / Inflation / Deflation), the full 26-voter vote breakdown, and the Arsenal SPY veto state.. all on the members dashboard.
Immediate Substack Alerts on Every Signal Change
The dashboard is for monitoring. The Substack e-mail is the source of record.. every regime flip, every veto, every override is announced via e-mail with my analysis of what shifted and why.
The Full Forward-Test Suite + Backtest History
All seven forward tests, including methodology and results, plus the full 23-year equity curve and trade history. If you want to verify the engine yourself before trusting it, the dashboard gives you everything you need.
What You're NOT Getting
The voter list, the regime-classification thresholds, the hysteresis parameters, or the Arsenal SPY veto code. MRE v06 is proprietary. You get the signal and the analysis; the engine itself stays in-house.
How to Use the Signal
Three ways members actually run it
The daily checker
Glances at the regime banner each morning with coffee. Does nothing 99% of the time — the entire point is the one morning it’s flipped. Thirty seconds a day, zero decisions on the other 364.
The weekly rebalancer
Checks once a week and trues up SPY exposure to the current signal — 100% when risk-on, cash when risk-off. Treats the engine like a thermostat, not a ticker.
The alert-only operator
Never opens the dashboard. Waits for the Substack email on a regime flip, rebalances that day, goes back to their life. The lowest-touch way to run it — and for most people, the right one.
Signal changes are infrequent.. about four per year on average. Don’t check every hour. When the signal flips, the e-mail will arrive. Combine MRE v06 with your own analysis.. the engine is one input, the strongest macro input I have, but it’s not omniscient. For asset-level Bitcoin trend timing, see Arsenal BTC.
I Don't Sell Hope
I built MRE v06 to answer one question: is the world friendly to risk assets right now, or not? I didn’t want to guess. I didn’t want to rely on vibes, narratives, or X consensus on what the Fed is going to do. I wanted a system that measures the answer quantitatively, across enough independent data streams that the conclusion is robust.. and then tells me in plain terms whether to be in or out.
Across 23 years of backtest, the answer was right enough that the Sharpe was >1.0, the max drawdown was −13%, and the engine outperformed buy-and-hold by 400+ percentage points cumulatively while spending almost a third of trading days in cash. Seven independent forward tests all passed.
I trade the live signal with my own capital. I publish it because $7 a month is a fair price for a system I spent over a year building. If the edge ever disappears I’ll tell you. If it needs fixing, I’ll fix it and explain what changed.
MRE v06 is a quantitative macro framework with a 23-year track record and seven forward tests behind it. It’s not a money printer and I’ll never sell it as one. But it’s the best macro signal I’ve ever built, I trade it every day, and it’s yours for less than the cost of a single bad trade.
.. Durden out.
MRE v06 regime signals, Arsenal engines, full members dashboard — starting at $7/mo.
Last updated: April 2026. Performance figures reflect backtested results on SPY from 2003-01-02 through 2026-04-28 (5,867 trading days, 23.32 years). Forward-test methodology and full results live on the forward-testing page. This content is for educational and informational purposes only. It does not constitute financial advice, investment advice, or a recommendation to buy or sell any asset. Trading equities involves substantial risk of loss. Past performance, whether backtested or live, does not guarantee future results. Backtested performance has inherent limitations: it is designed with the benefit of hindsight, does not reflect actual trading, and does not account for all factors that may affect real-world execution. The author is not a licensed financial advisor. Always do your own research and consult a qualified financial professional before making investment decisions. You are solely responsible for your own trading decisions.