Why Most Trend Systems Fail on Bitcoin
Most trend-following systems on Bitcoin fail for one of two reasons.
Too fast. Short-period crossover systems catch trends early but also fire on every 3-day fakeout. On an asset that routinely moves 10–15% in a week and reverses, a fast system churns through equity in whipsaw losses. You buy the top of a bounce and sell the bottom of a dip, repeatedly. Over a full cycle, the false signals eat the real ones alive.
Too slow. Long-period systems eliminate whipsaw but enter so late that you miss the explosive early phase of a move — and exit so late that you give back 20–30% of the peak. Bitcoin's secular trend is so aggressively upward that being out of position for even a few weeks during a parabolic move is devastating to compounded returns.
I built the 8th Rule because I was tired of those two options. I wanted a system that would make the decision for me — and get it right more often than not, with smaller losses when it's wrong and bigger gains when it's right.
The 8th Rule solves this by being two systems in one, running at different speeds, connected by dynamic position sizing. The first system is fast. The second system is accurate. You don't have to choose between them.
No Code, Just Logic
The system has three layers that work together to create an asymmetric payoff structure: lose small on fakeouts, win big on real trends.
Layer 1: GVTS — The Fast Trigger
This is the entry engine. It processes price through multiple stages of smoothing and filtering to identify the moment a trend flips direction. The key design choices: it uses a Gaussian smoothing kernel instead of standard moving averages, making it naturally resistant to flash crashes and liquidation wicks. It wraps the smoothed trend in volatility-based envelopes that widen and tighten with the market. And it applies an intentional asymmetry — it's harder to trigger a bull signal than a bear signal. The system is skeptical of entries and paranoid about exits.
Layer 2: VATS — The Slow Confirmation
This is the conviction engine. It runs on completely different math than GVTS. It calculates a z-score — a statistical measure of how far short-term momentum has separated from the long-term baseline, normalized by current volatility. A high z-score means "this move is real relative to the noise." A z-score near zero means "this could be nothing." VATS automatically adjusts its sensitivity to the volatility regime: during calm markets, a smaller move triggers confirmation; during chaotic markets, it demands a larger move. This self-scaling prevents over-triggering during mania phases or under-triggering during accumulation.
Layer 3: Dynamic Position Sizing — The Bridge
This is where the magic happens. When GVTS flips bullish, you enter at 25% of equity — not 100%. If GVTS is wrong and reverses before VATS confirms, you exit at 25% exposure. Your loss on a whipsaw is one-quarter of what a standard system would cost you. If VATS confirms, you size up to 100%. The result: you lose small on fakeouts and win big on real trends. The asymmetric payoff distribution is the core edge.
Exit Logic Scales With Exposure
At 25%, only GVTS turning bearish triggers an exit — loose leash, small money. At 100%, either GVTS turning bearish or VATS losing conviction triggers an exit — tight leash, big money. The system protects more aggressively the more capital it has deployed.
| Scenario | Position Size | Outcome |
|---|---|---|
| False signal, never confirmed | 25% | Small loss — quarter of what a standard system costs |
| Signal confirmed, trend continues | 100% | Full gain on a real trend |
| Signal confirmed, trend reverses | 100% → exit | Full loss, but dual-exit limits damage fast |
What the Data Says
The 8th Rule has been backtested on Bitcoin from 2014 through March 2026 — roughly 12 years covering every major bull run, bear market, and sideways chop period in Bitcoin's history.
| Metric | Result |
|---|---|
| Net Return | ~47,550% ($10k → ~$4.77M) |
| CAGR | ~65.5% |
| Sharpe Ratio | 1.54 |
| Profit Factor | 4.62 — every $1 lost generated $4.62 in gains |
| Win Rate | 70% |
| Max Drawdown (Mark-to-Market) | −47.6% |
| Max Drawdown (Close-to-Close) | −24.1% |
| Total Trades | 56 |
For context: a profit factor above 2.0 is considered strong by quantitative traders. Above 3.0 is exceptional. This system runs at 4.62. Every dollar lost generated $4.62 in gains. And the 25% buffer means whipsaw losses — the ones that kill most trend-following systems on Bitcoin — are quartered before they even hit your equity curve.
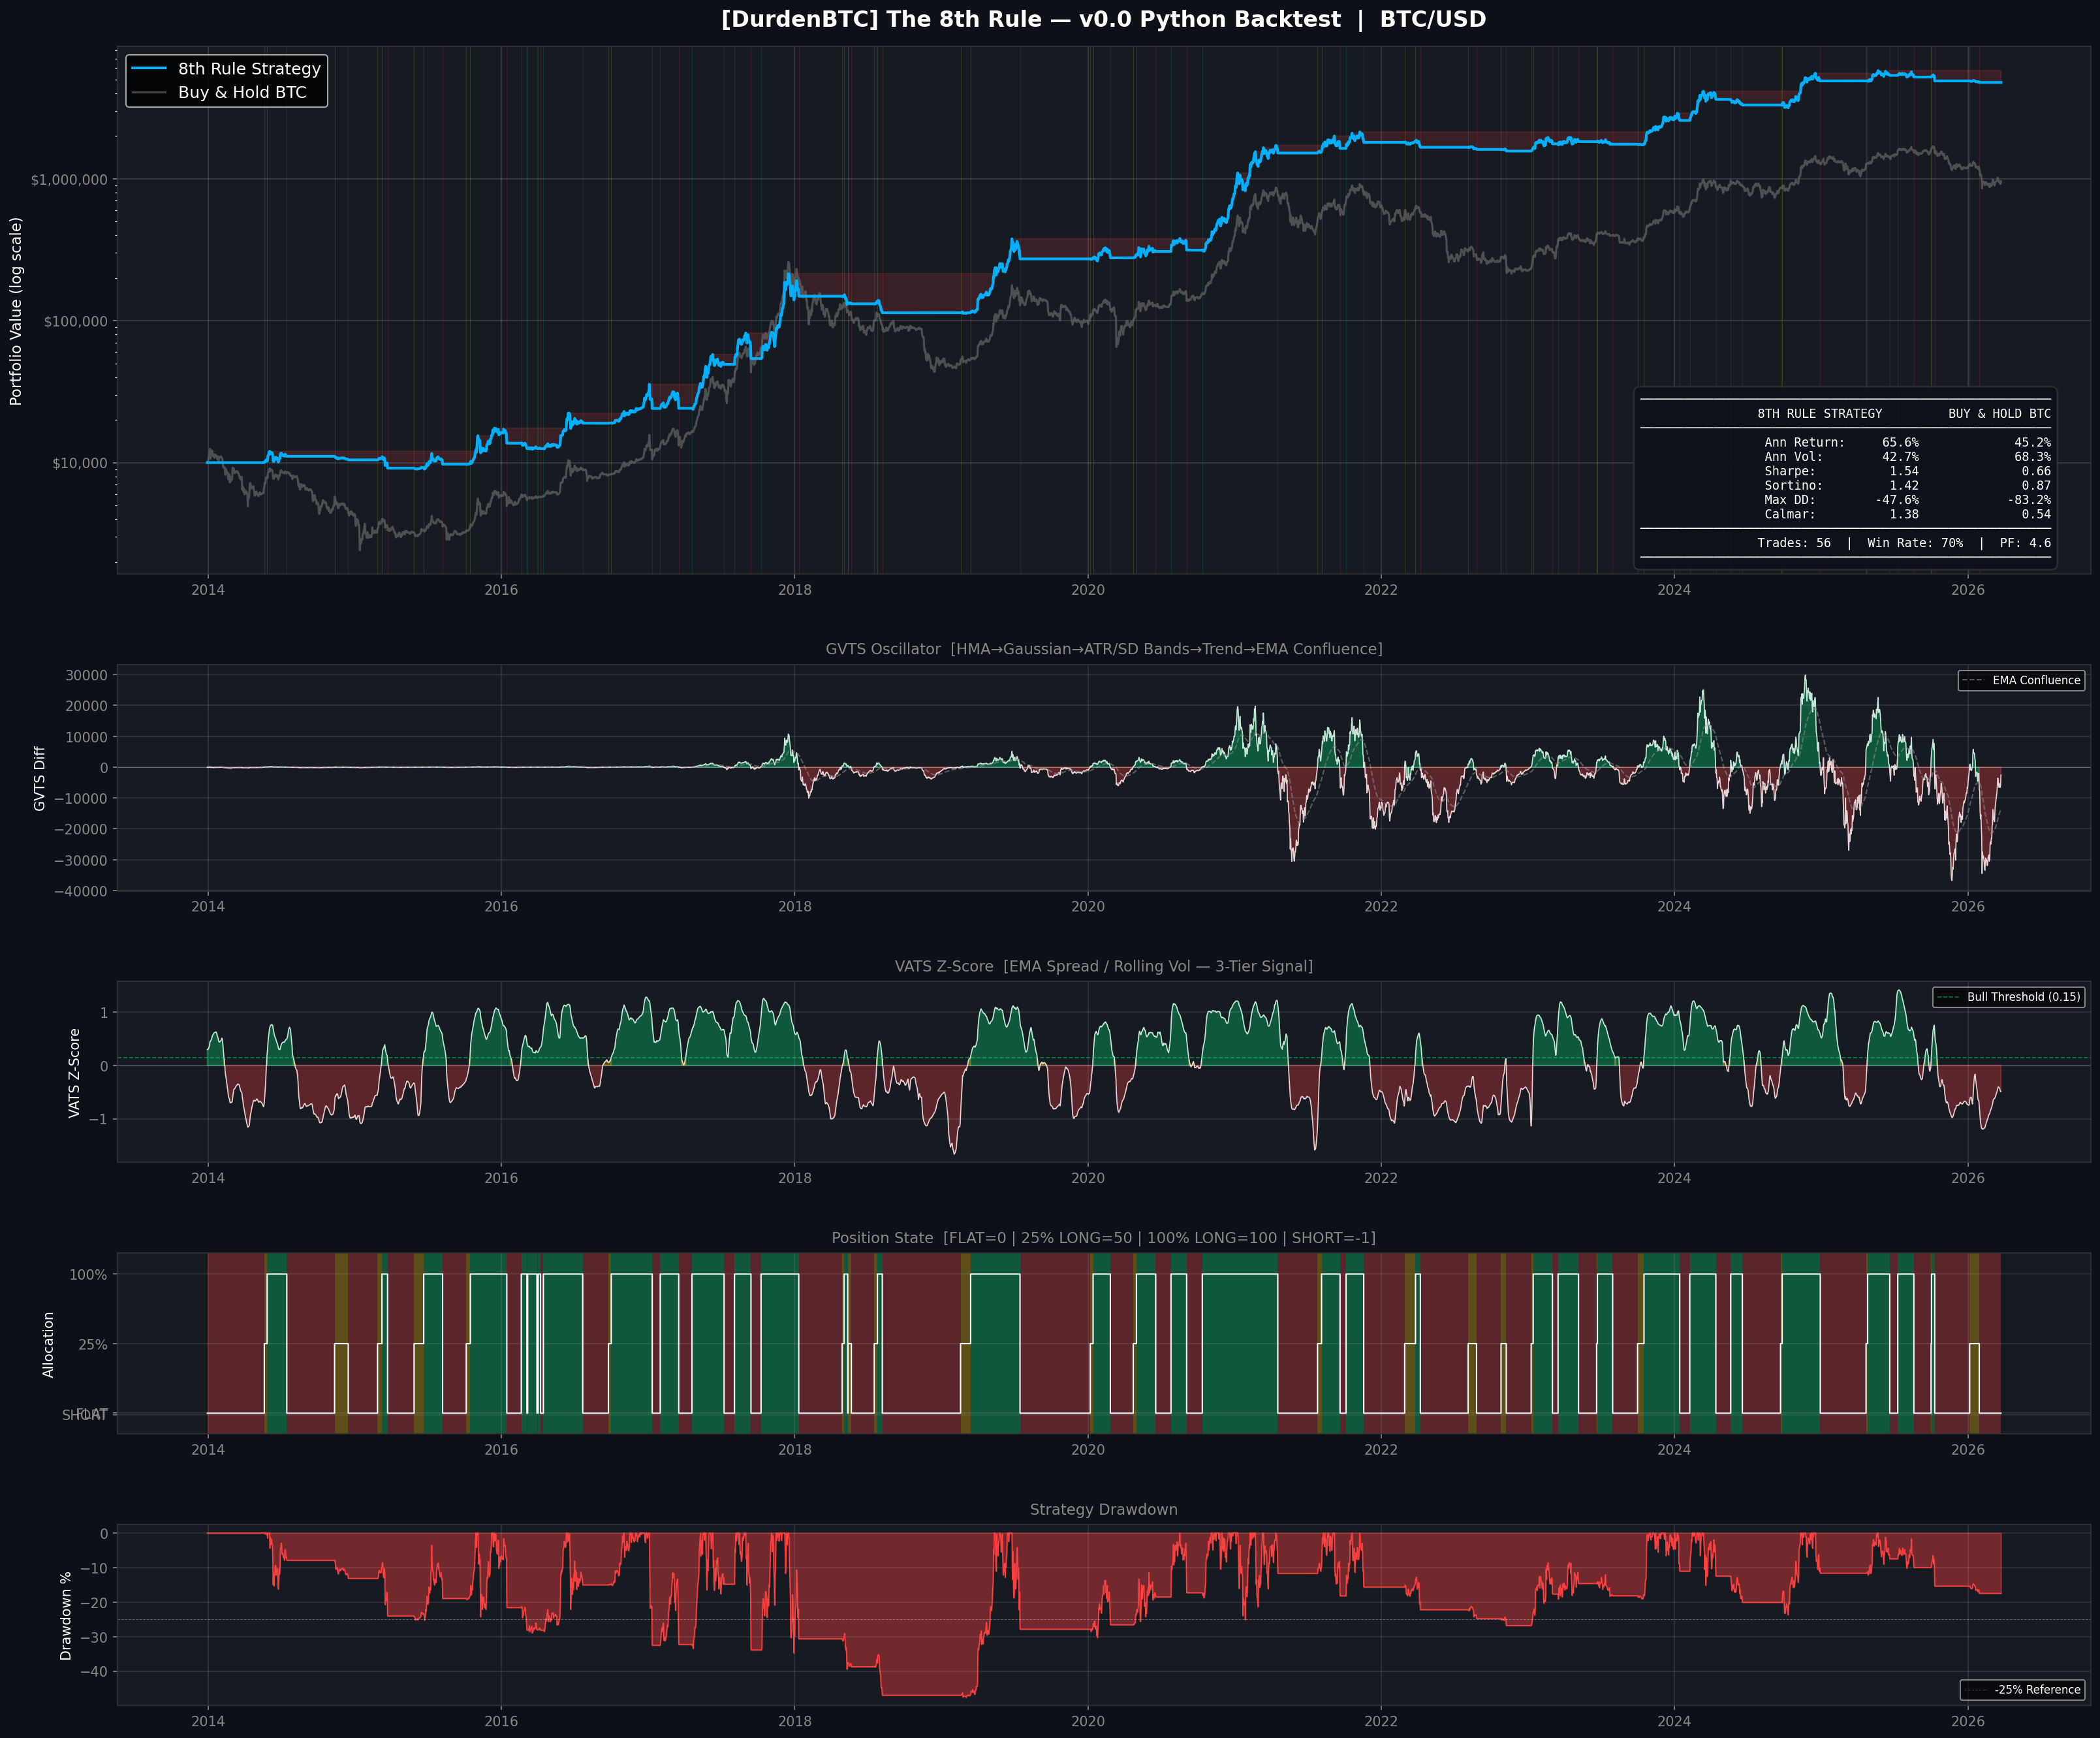
Buy-and-hold Bitcoin experienced drawdowns of −83% (2018) and −77% (2022). The 8th Rule's worst close-to-close drawdown across the full backtest is −24.1%. If you hold through a 77% drawdown, you need a 335% gain just to break even. The 8th Rule enters each new cycle compounding from near its equity peak — not digging out of a crater. Over multiple cycles, that gap becomes enormous.
Proving It Isn't Curve-Fit
I ported the entire indicator to a standalone Python backtesting engine to verify the TradingView results independently and run tests that TradingView can't do. The Python engine matches TradingView's trade log exactly — same entry dates, same exit dates, same prices from 2018 onward (minor 1-day offsets pre-2018 due to different price sources, not logic differences).
Walk-Forward Test — 11 Rolling 2-Year Windows
Every single window produced a positive Sharpe ratio. Range: 0.83 to 3.35. No dead zones. The system works consistently across bull markets, bear markets, and sideways chop without any parameter changes. This is the strongest evidence against overfitting — the parameters aren't tuned to one specific period.
Monte Carlo — Return Bootstrap (1,000 Simulations)
Sharpe ratio 95% confidence interval: [0.81, 2.00]. Probability of Sharpe > 0: 100%. Even at the statistical lower bound, the system maintains a meaningful edge.
Monte Carlo — Trade Bootstrap (1,000 Simulations)
The actual final value landed at the 51st percentile of bootstrapped paths. Dead center. The result is not dependent on a lucky sequence of trades.
Out-of-Sample Test
Data split in half. Tuned on the first ~6 years, then ran forward on the next ~6 years with no parameter changes. In-sample profit factor: ~6. Out-of-sample profit factor: ~3+. It dropped — as expected, it always does — but held well above the 2.0 threshold most quantitative traders consider meaningful. A system that maintains a 3+ profit factor out-of-sample is performing on genuine structural edge, not curve-fitting.
Random Entry Test (500 Simulations)
The actual CAGR beats 61% of random entries with the same holding periods. Some of the return comes from Bitcoin's secular upward trend — you'd make money with random entries too — but the system adds meaningful alpha on top through timing.
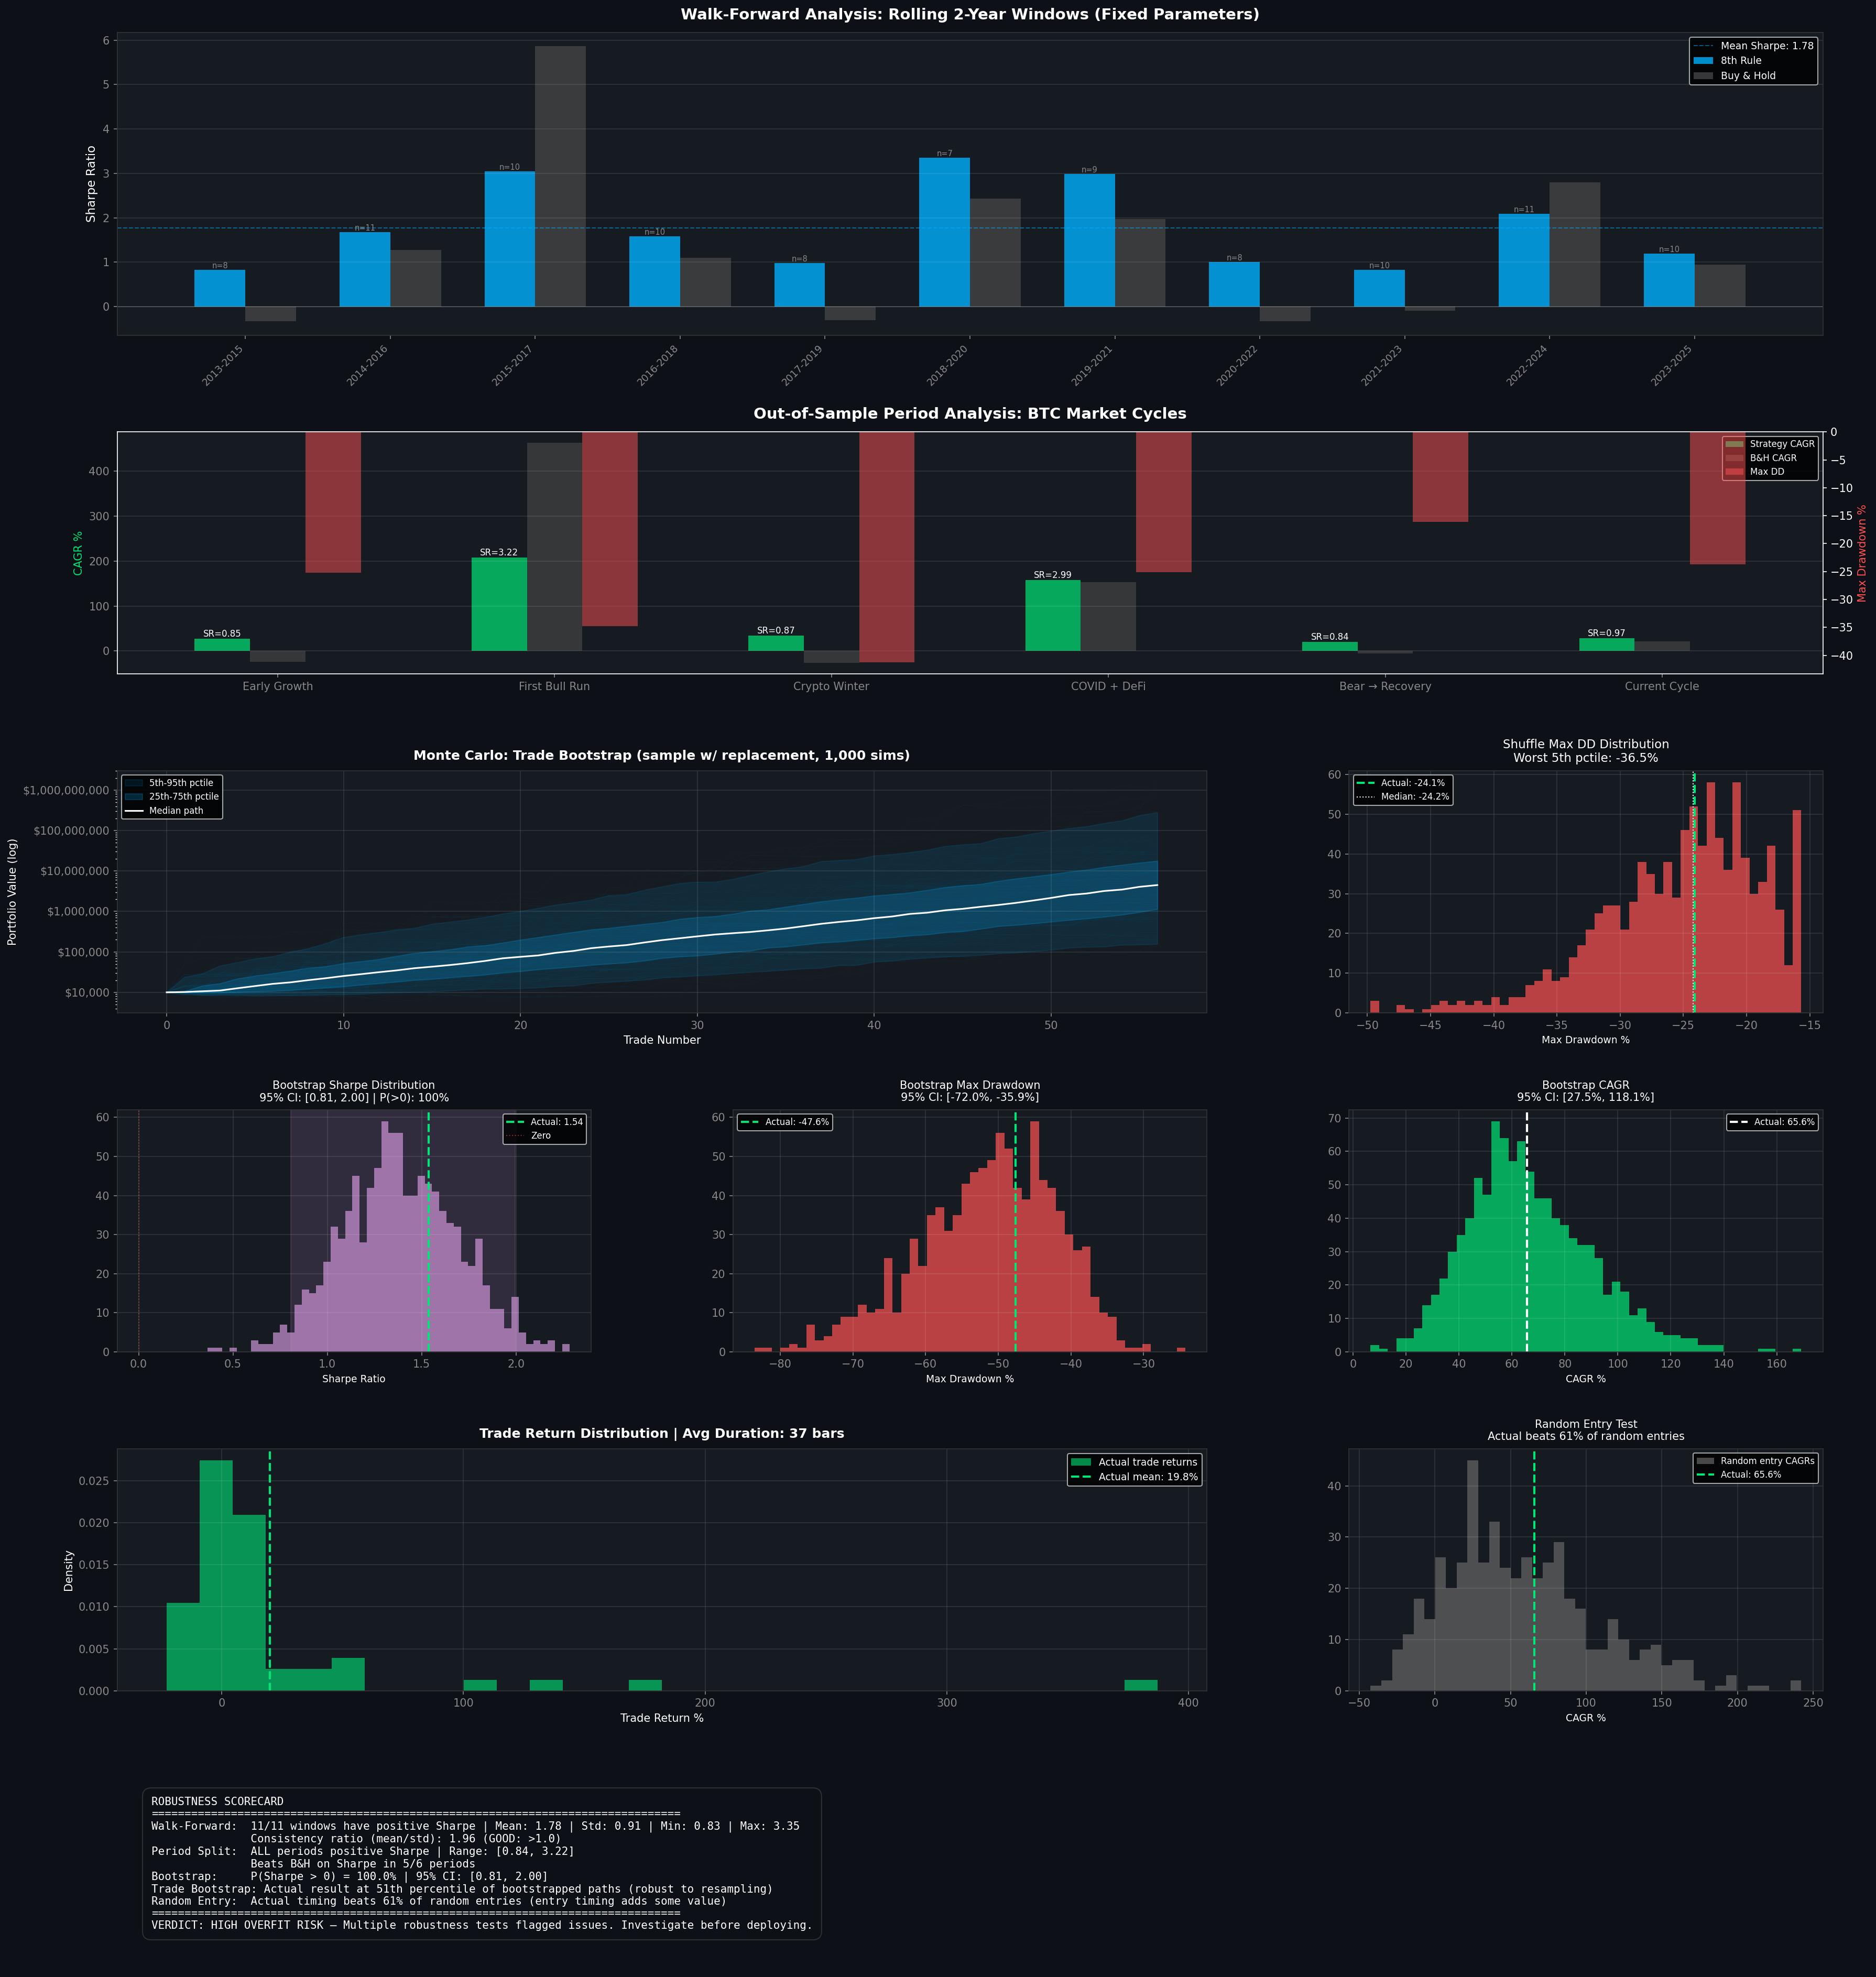
The system beats buy-and-hold Sharpe in 5 of 6 major BTC market periods. It excels during bear markets (Crypto Winter Sharpe: 0.87 vs −0.35, Bear→Recovery: 0.84 vs −0.11) and slightly trails during the most explosive bull runs. This is the expected behavior — the system's real value is as a risk management tool that keeps you compounding from near the equity peak instead of clawing back from a crater.
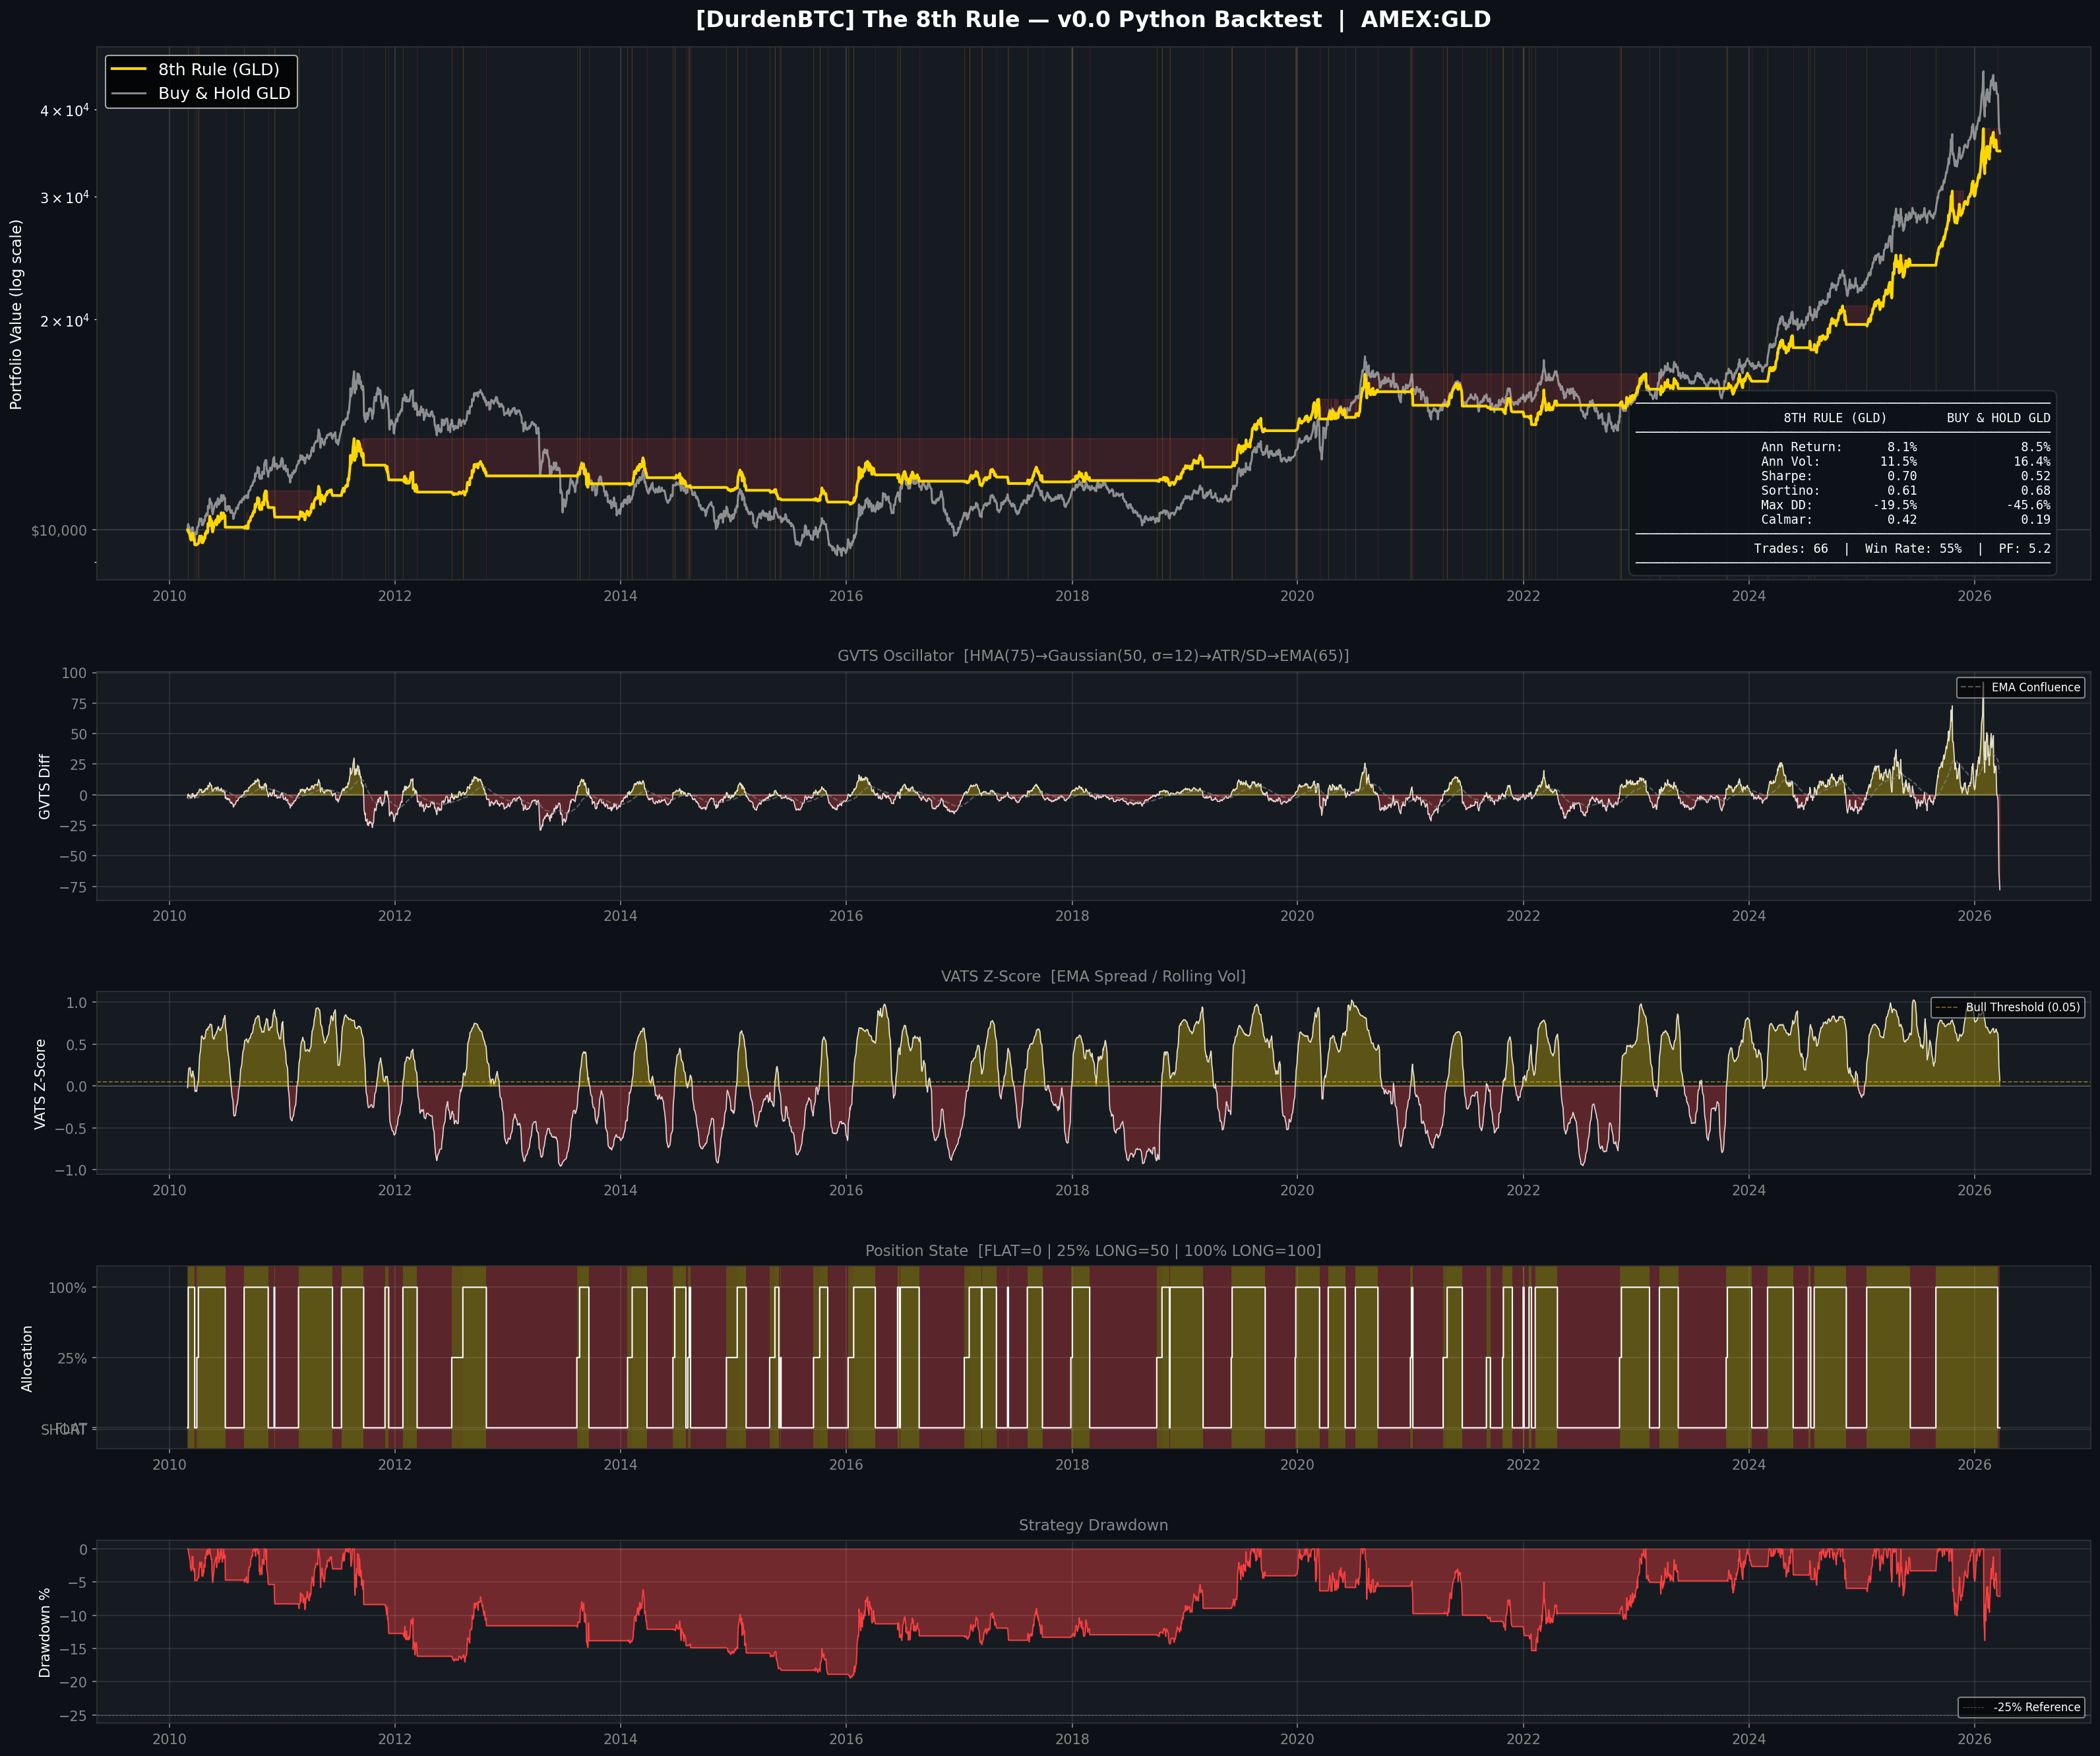
8th Rule on $GLD
The same GVTS + VATS architecture works on Gold with tuned parameters. The logic is identical — Gaussian-filtered trend detection, z-score confirmation, dynamic position sizing — but the inputs are calibrated for Gold's different volatility structure and trend character. Gold grinds rather than explodes. The 8th Rule handles this with adjusted parameters tuned to Gold's slower, less volatile trend structure.
| Metric | 8th Rule (GLD) | Buy & Hold GLD |
|---|---|---|
| Net Return | ~249% ($10k → ~$34.8k) | — |
| CAGR | 8.1% | — |
| Sharpe Ratio | 0.70 | 0.53 |
| Max Drawdown | −19.5% | −45.6% |
| Profit Factor | 5.19 | — |
| Backtest Period | 2010 – 2026 (~16 years) | — |
| Total Trades | 66 | — |
The Gold numbers tell a different story than BTC. The raw return is lower — Gold doesn't have Bitcoin's parabolic upside. But look at the risk-adjusted picture: the system's Sharpe (0.70) beats buy-and-hold (0.53), and the max drawdown is cut by more than half (−19.5% vs −45.6%). The profit factor of 5.19 is actually higher than BTC's.
If you're running BTC as your growth sleeve and Gold as your store-of-value sleeve, the 8th Rule gives you a systematic framework for both. The BTC sleeve compounds aggressively during bull markets. The Gold sleeve protects capital during macro uncertainty with dramatically lower drawdowns. Both use the same decision logic — you're not switching between systems, you're applying the same edge across different volatility regimes. For the broader macro allocation layer that tells you whether the global environment is risk-on or risk-off, see The Macro Regime Engine.
The Honest Answer
It Dodges the Drawdowns That Destroy Compounding
Buy-and-hold Bitcoin has experienced drawdowns of −83%, −77%, and multiple −30 to −50% corrections. If you hold through a 77% drawdown, you need a 335% gain just to break even. Read that again. The 8th Rule enters each new cycle compounding from near its equity peak, not clawing back from a crater. Over multiple cycles, this gap becomes enormous.
The 25% Buffer Absorbs Chop Without Sacrificing Speed
Most systems that avoid drawdowns also miss large chunks of the upside — slow in, slow out, and the "cost of insurance" eats the alpha. The 25% entry means the system commits capital at the first sign of trend (fast), but the cost of being wrong is quartered. You get speed without fragility.
Volatility Normalization Scales With the Asset
Bitcoin at $3,000 has a different volatility profile than Bitcoin at $100,000. A z-score-based confirmation layer doesn't care about the dollar price — it cares about statistical significance. A move that registers as meaningful is meaningful whether the underlying is at $1k or $100k. The system doesn't need to be re-tuned as Bitcoin matures.
The Gaussian Filter Resists Manipulation
Standard moving averages react proportionally to every bar. A sudden 15% wick from a liquidation cascade will jolt an SMA or EMA significantly. The Gaussian filter's bell-curve weighting means single anomalous bars contribute almost nothing to the signal. The system essentially ignores flash crashes, responding only to sustained directional movement. On an asset routinely subject to exchange-driven liquidity events, this is a structural advantage.
Read This Carefully
I'm going to be more honest here than most people selling indicators are, because I think you deserve it.
The system has roughly 15 adjustable parameters calibrated across approximately 2.5 full Bitcoin market cycles. The parameters have logical justifications and aren't weirdly precise — no "ATR factor of 0.8347" type nonsense — but the honest truth is that any system tuned to historical data will look better in backtesting than it performs live. The walk-forward analysis and Monte Carlo tests are encouraging, but treat the backtest numbers as a ceiling, not a floor.
Every bear market in the backtest was a cyclical drawdown within a secular bull trend. The system has never been tested in a world where Bitcoin enters a prolonged decline or a multi-year sideways range (the way gold did 2013–2018 or Japanese equities did for decades). Trend-following systems struggle in range-bound markets. If Bitcoin ever stops trending, the system's edge will degrade. I don't think this is the base case, but I can't rule it out — and neither can you.
The backtest assumes daily bar close execution with 0.01% commission and zero slippage. In reality, you're executing on whatever exchange you use, at whatever time, with whatever liquidity is available. A few percent of slippage per trade over dozens of trades across years will reduce real-world returns. Execute as close to the daily close as reasonably possible.
I know this sounds like boilerplate, but I mean it specifically: the conditions that produced a 4.62 profit factor — Bitcoin's explosive growth from $500 to $100k+, its specific volatility signature, its market microstructure — may not repeat. The system is designed to be adaptive, but no system survives every regime change intact. If the numbers degrade over time, I'll tell you. I've already documented a bug fix that reduced backtest performance because the old number was inflated by an error. I'll always give you the real number.
What Subscribers Receive
The Indicator on TradingView
A non-repainting, daily-timeframe trend-following system for Bitcoin and Gold. Add it to any major BTC pair or AMEX:GLD with the Gold parameter preset. The on-chart dashboard tells you the current state, allocation level, and what would trigger the next action.
Signal Alerts
The indicator fires signals. I flag every regime change clearly with analysis on what shifted and why. BTC and Gold signals are posted in the War Room and available in the private Members area.
Ongoing Research & System Development
Access to my macro regime analysis, system updates, and transparent performance accounting. If the system enters a trade that loses, I'll tell you it lost and explain why.
A System I Trade With My Own Money
This isn't something I built to sell. It's something I built because I needed it. I share the signals because I believe they have genuine value — and $7 a month is a fair price for a system I spent over a year building.
How to Use It
Add the Indicator to a Daily Chart
Works on INDEX:BTCUSD or any major BTC pair. For Gold, apply to AMEX:GLD with the Gold parameter preset. Ensure both "recalculate" boxes are checked in the indicator properties tab.
Watch the Dashboard
It tells you the current state: GVTS direction, VATS z-score, current allocation level, and what would trigger the next action. The hourglass PENDING indicator shows when a signal might trigger but hasn't confirmed yet.
Follow Signals at Daily Bar Close
Don't act on intraday movement. The system fires at the close of each daily candle. When a size-up triggers, execute it immediately. Don't front-run signals.
Scale to Your Risk Tolerance
If 25%/100% is too aggressive, scale both numbers down proportionally. The edge comes from the ratio between reduced and full allocation, not the absolute numbers.
Stay the Course
The system's edge is statistical, not trade-by-trade. Any single trade can lose. The edge emerges from consistent execution across dozens of trades over years. The worst thing you can do is override the system because one trade went wrong.
Something Honest
I built the 8th Rule because I was tired of staring at charts trying to decide if a dip was a buying opportunity or the start of a bear market. I wanted a system that would make the decision for me — and get it right more often than not, with smaller losses when it's wrong and bigger gains when it's right.
That's what this does. Not perfectly. Not every time. But consistently enough, over enough trades, with enough mathematical rigor, that I trust it with my own capital.
If the edge ever disappears, I'll tell you. If the system needs changing, I'll change it and explain why. If a bug reduces performance, I'll show you the real numbers. I've already done this once.
This is a decision-support tool that tells you when to enter, when to size up, and when to exit. It's not a money printer and I'll never sell it as one. But it's the best trend system I've ever built, I use it every single day, and it's yours for less than the cost of a single bad trade.
— Durden out.
8th Rule signals, macro analysis & full trade transparency — starting at $7/mo.
Last updated: March 2026. This page reflects the current version of The 8th Rule (v9). System parameters and performance data will be updated as needed. This content is for educational and informational purposes only. It does not constitute financial advice, investment advice, or a recommendation to buy or sell any asset. Trading cryptocurrencies and commodities involves substantial risk of loss. Past performance, whether backtested or live, does not guarantee future results. Backtested performance has inherent limitations: it is designed with the benefit of hindsight, does not reflect actual trading, and does not account for all factors that may affect real-world execution. The author is not a licensed financial advisor. Always do your own research and consult a qualified financial professional before making investment decisions. You are solely responsible for your own trading decisions.