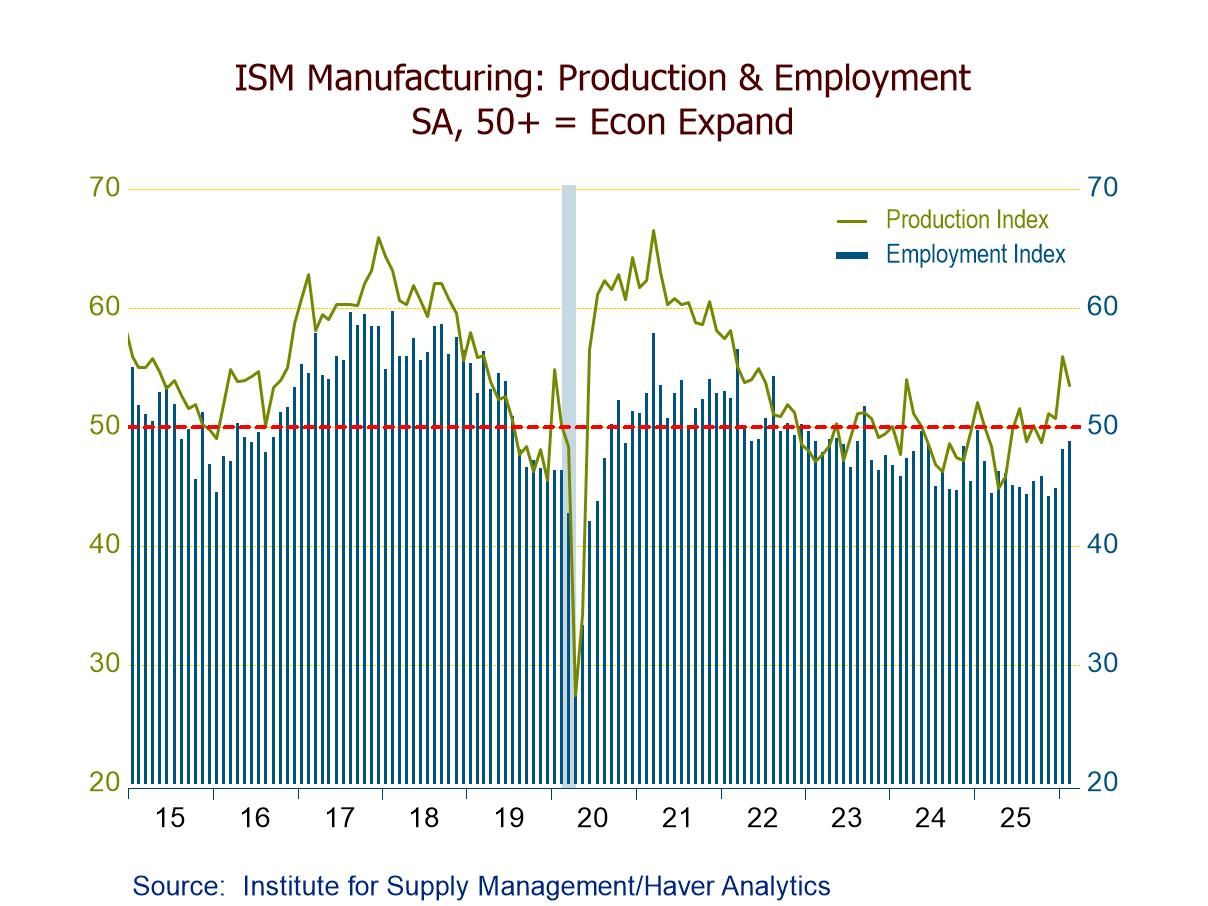
What Is ISM Manufacturing?
The ISM Manufacturing PMI (Purchasing Managers' Index) is a monthly survey of approximately 400 purchasing managers at US manufacturing firms. They're asked about new orders, production, employment, supplier deliveries, and inventories. The responses are aggregated into a single number.
Above 50 = expansion. The manufacturing sector is growing. Factories are ordering more materials, hiring more workers, shipping more product. Below 50 = contraction. The reverse: orders declining, production slowing, layoffs beginning.
The 50 line is the dividing line between a growing and shrinking real economy. It's one of the most watched leading indicators in macro because it captures real activity.. not financial market speculation, not survey sentiment, not AI hype. Purchasing managers are spending company money. They know the actual demand pipeline 3–6 months before it shows up in GDP.
GDP is released quarterly with a one-quarter lag. Employment data is monthly with revisions. ISM is monthly, with no revisions, based on actual business decisions being made right now. When ISM turns, the business cycle is turning — and the financial system responds within weeks.
ISM and Bitcoin
The ISM-Bitcoin correlation isn't direct. You won't find a clean chart overlay where ISM goes up and Bitcoin goes up the next day. The relationship works through a three-step transmission mechanism:
Step 1: ISM signals the growth regime. When ISM turns up from below 50, it means the manufacturing economy is shifting from contraction to expansion. This is the early-cycle recovery signal.
Step 2: Growth shifts Fed expectations. Improving growth in a low-inflation environment makes the Fed more likely to ease, or at least less likely to tighten. Markets price in rate cuts. Yield curves steepen. Liquidity expectations improve.
Step 3: Liquidity drives Bitcoin. As actual and expected liquidity increases, capital flows up the risk curve. Bonds first, then equities, then high-beta assets. Bitcoin which is the highest-beta liquid asset in existence.. captures the final wave.
| ISM Reading | Cycle Phase | Fed Response | Bitcoin Tendency |
|---|---|---|---|
| < 45 | Deep Contraction | Emergency easing | Bottoming (accumulation zone) |
| 45 → 50 | Recovery Beginning | Easing continues | Early rally |
| 50 → 55 | Expansion | Neutral to tightening | Strong rally — sweet spot |
| > 55 | Overheating | Tightening | Late cycle — watch for regime shift |
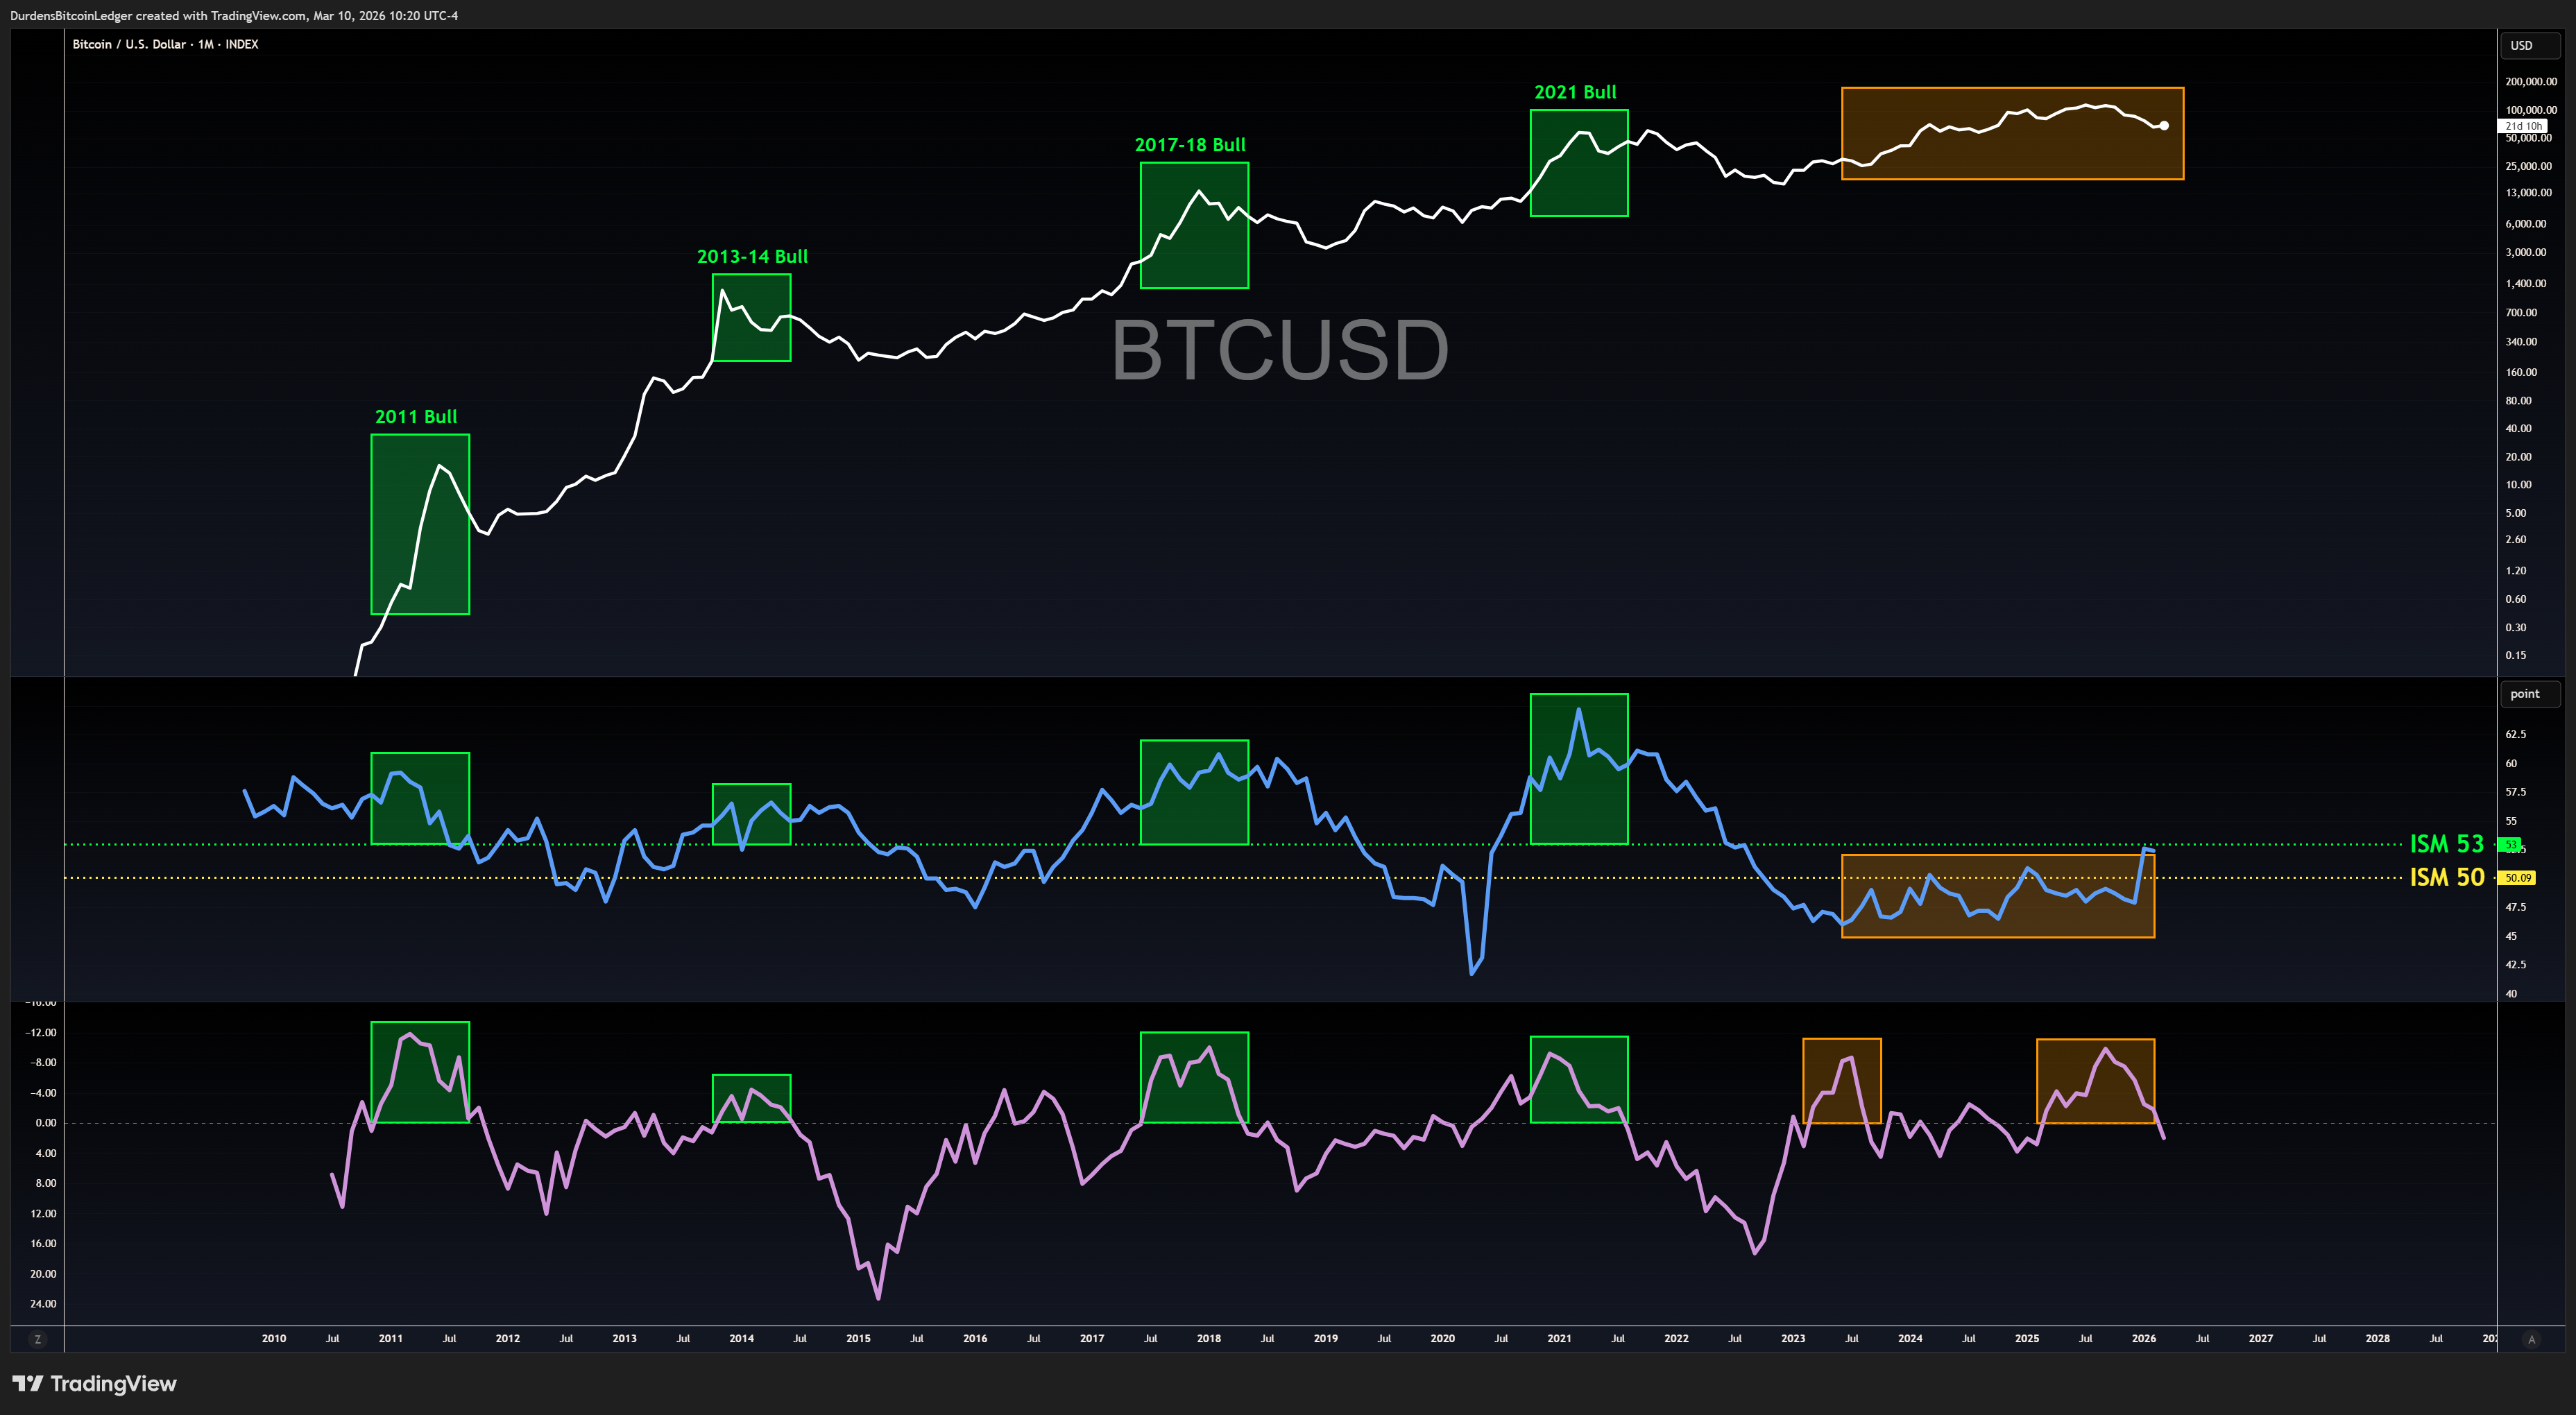
The sweet spot for Bitcoin is ISM crossing above 50.. the transition from contraction to expansion. This is when the business cycle is accelerating, the Fed is still accommodative, and global M2 is expanding. It's the confluence of all three macro forces (growth, liquidity, and contained inflation) aligning simultaneously.
The "Banana Zone" Myth
In late 2024 and early 2025, a popular narrative swept through crypto Twitter: the "Banana Zone." The thesis was simple.. Taiwan Semiconductor Export data (a proxy for global AI demand) correlated tightly with Bitcoin price. Both were accelerating. The overlay chart looked incredible. Therefore, Bitcoin was going to continue ripping alongside the AI boom.
It broke.
In early 2026, ISM printed 47.9: contraction. The real economy was slowing despite the AI boom. Taiwan exports continued strong, but Bitcoin sold off alongside the broader macro deterioration. The gap between the "AI/Tech" narrative and the actual business cycle widened into a chasm.
Correlations work until they don't. Single-indicator overlays are the financial equivalent of astrology.. you can always find a chart that fits until it stops fitting. You can't trade on "what should happen." You trade on what is happening. The ISM was telling you the real economy was weak. The Banana Zone was telling you a story. The ISM was right.
This is exactly why the Macro Regime Engine uses 20+ assets across 6 asset classes instead of one clever chart overlay. Any single correlation can break when the regime shifts. A broad-based voting system survives regime shifts because it's measuring the environment from 20+ different angles simultaneously.
ISM in the Macro Framework
ISM doesn't directly feed into the Macro Regime Engine as a voting asset.. it's an economic indicator, not a tradeable instrument. But it provides critical context for interpreting the regime classification.
The regime engine's four quadrants are built on two axes: growth (up/down) and inflation (up/down). ISM is the best real-time proxy for the growth axis. When ISM is above 50 and rising, the engine is more likely to classify Goldilocks or Reflation. When ISM is below 50 and falling, the engine leans toward Deflation or Inflation.
Practically, ISM serves as a conviction multiplier. If the regime engine says Goldilocks and ISM just crossed above 50, that's higher conviction than Goldilocks with ISM at 52 and falling. The engine provides the signal; ISM provides the confidence level.
It also interacts with the liquidity model. When ISM is improving, the Fed is less likely to tighten, which means liquidity conditions are more likely to stay favorable. When ISM is deteriorating, the Fed may ease.. which means future liquidity improvement is coming. Either way, ISM changes are leading signals for the liquidity cycle that ultimately drives Bitcoin's price action.
One Signal in the Orchestra
"ISM is the pulse of the real economy. But a pulse alone doesn't diagnose the patient."
ISM Manufacturing is one of the most valuable macro indicators for Bitcoin context.. but it is not, and never will be, a standalone buy signal. It tells you about the business cycle. It does not tell you about positioning, sentiment, technical structure, or the dozen other factors that influence short-term price.
Use ISM as context. Layer it with global M2, credit spreads, the regime classification, and the entry signals. When all layers align — ISM crossing 50, M2 expanding, regime Goldilocks, the 8th rule confirmed.. that's the highest-conviction setup in the framework. When they diverge, reduce conviction and size accordingly. Check the research section for current readings.