What Is Global M2 and Why It Matters
M2 is the broadest commonly tracked measure of money supply. It includes physical currency, checking accounts, savings accounts, money market funds, and other "near money".. essentially, all the dollars (and euros, and yuan, and yen) that are readily available to flow into assets.
Global M2 aggregates this across 20+ countries, converted to USD terms. When global M2 is expanding, there's more liquidity in the system. More liquidity means more capital chasing returns. More capital chasing returns means risk assets go up.. equities, commodities, and especially Bitcoin.
Central banks create money. That money flows through the banking system, into bond markets, into equities, and eventually into the highest-beta, most liquid risk assets on the planet. Bitcoin sits at the very end of that chain.. the last to receive the flow, but the most violent in its response.
Trading Bitcoin without tracking global money supply is like betting blind. You might win some hands, but you're playing against the house. The house, in this case, is every central bank on earth. Track what they're doing, and you know which way the current is flowing.
This is why the broader liquidity model.. Fed balance sheet, TGA, RRP, and global M2.. is the first layer in any serious macro framework. MRE v06 incorporates liquidity signals as part of its 26-voter cross-asset system. M2 is the fuel. The regime engine measures the weather. Together, they tell you whether to deploy or defend.
The Bitcoin–M2 Correlation
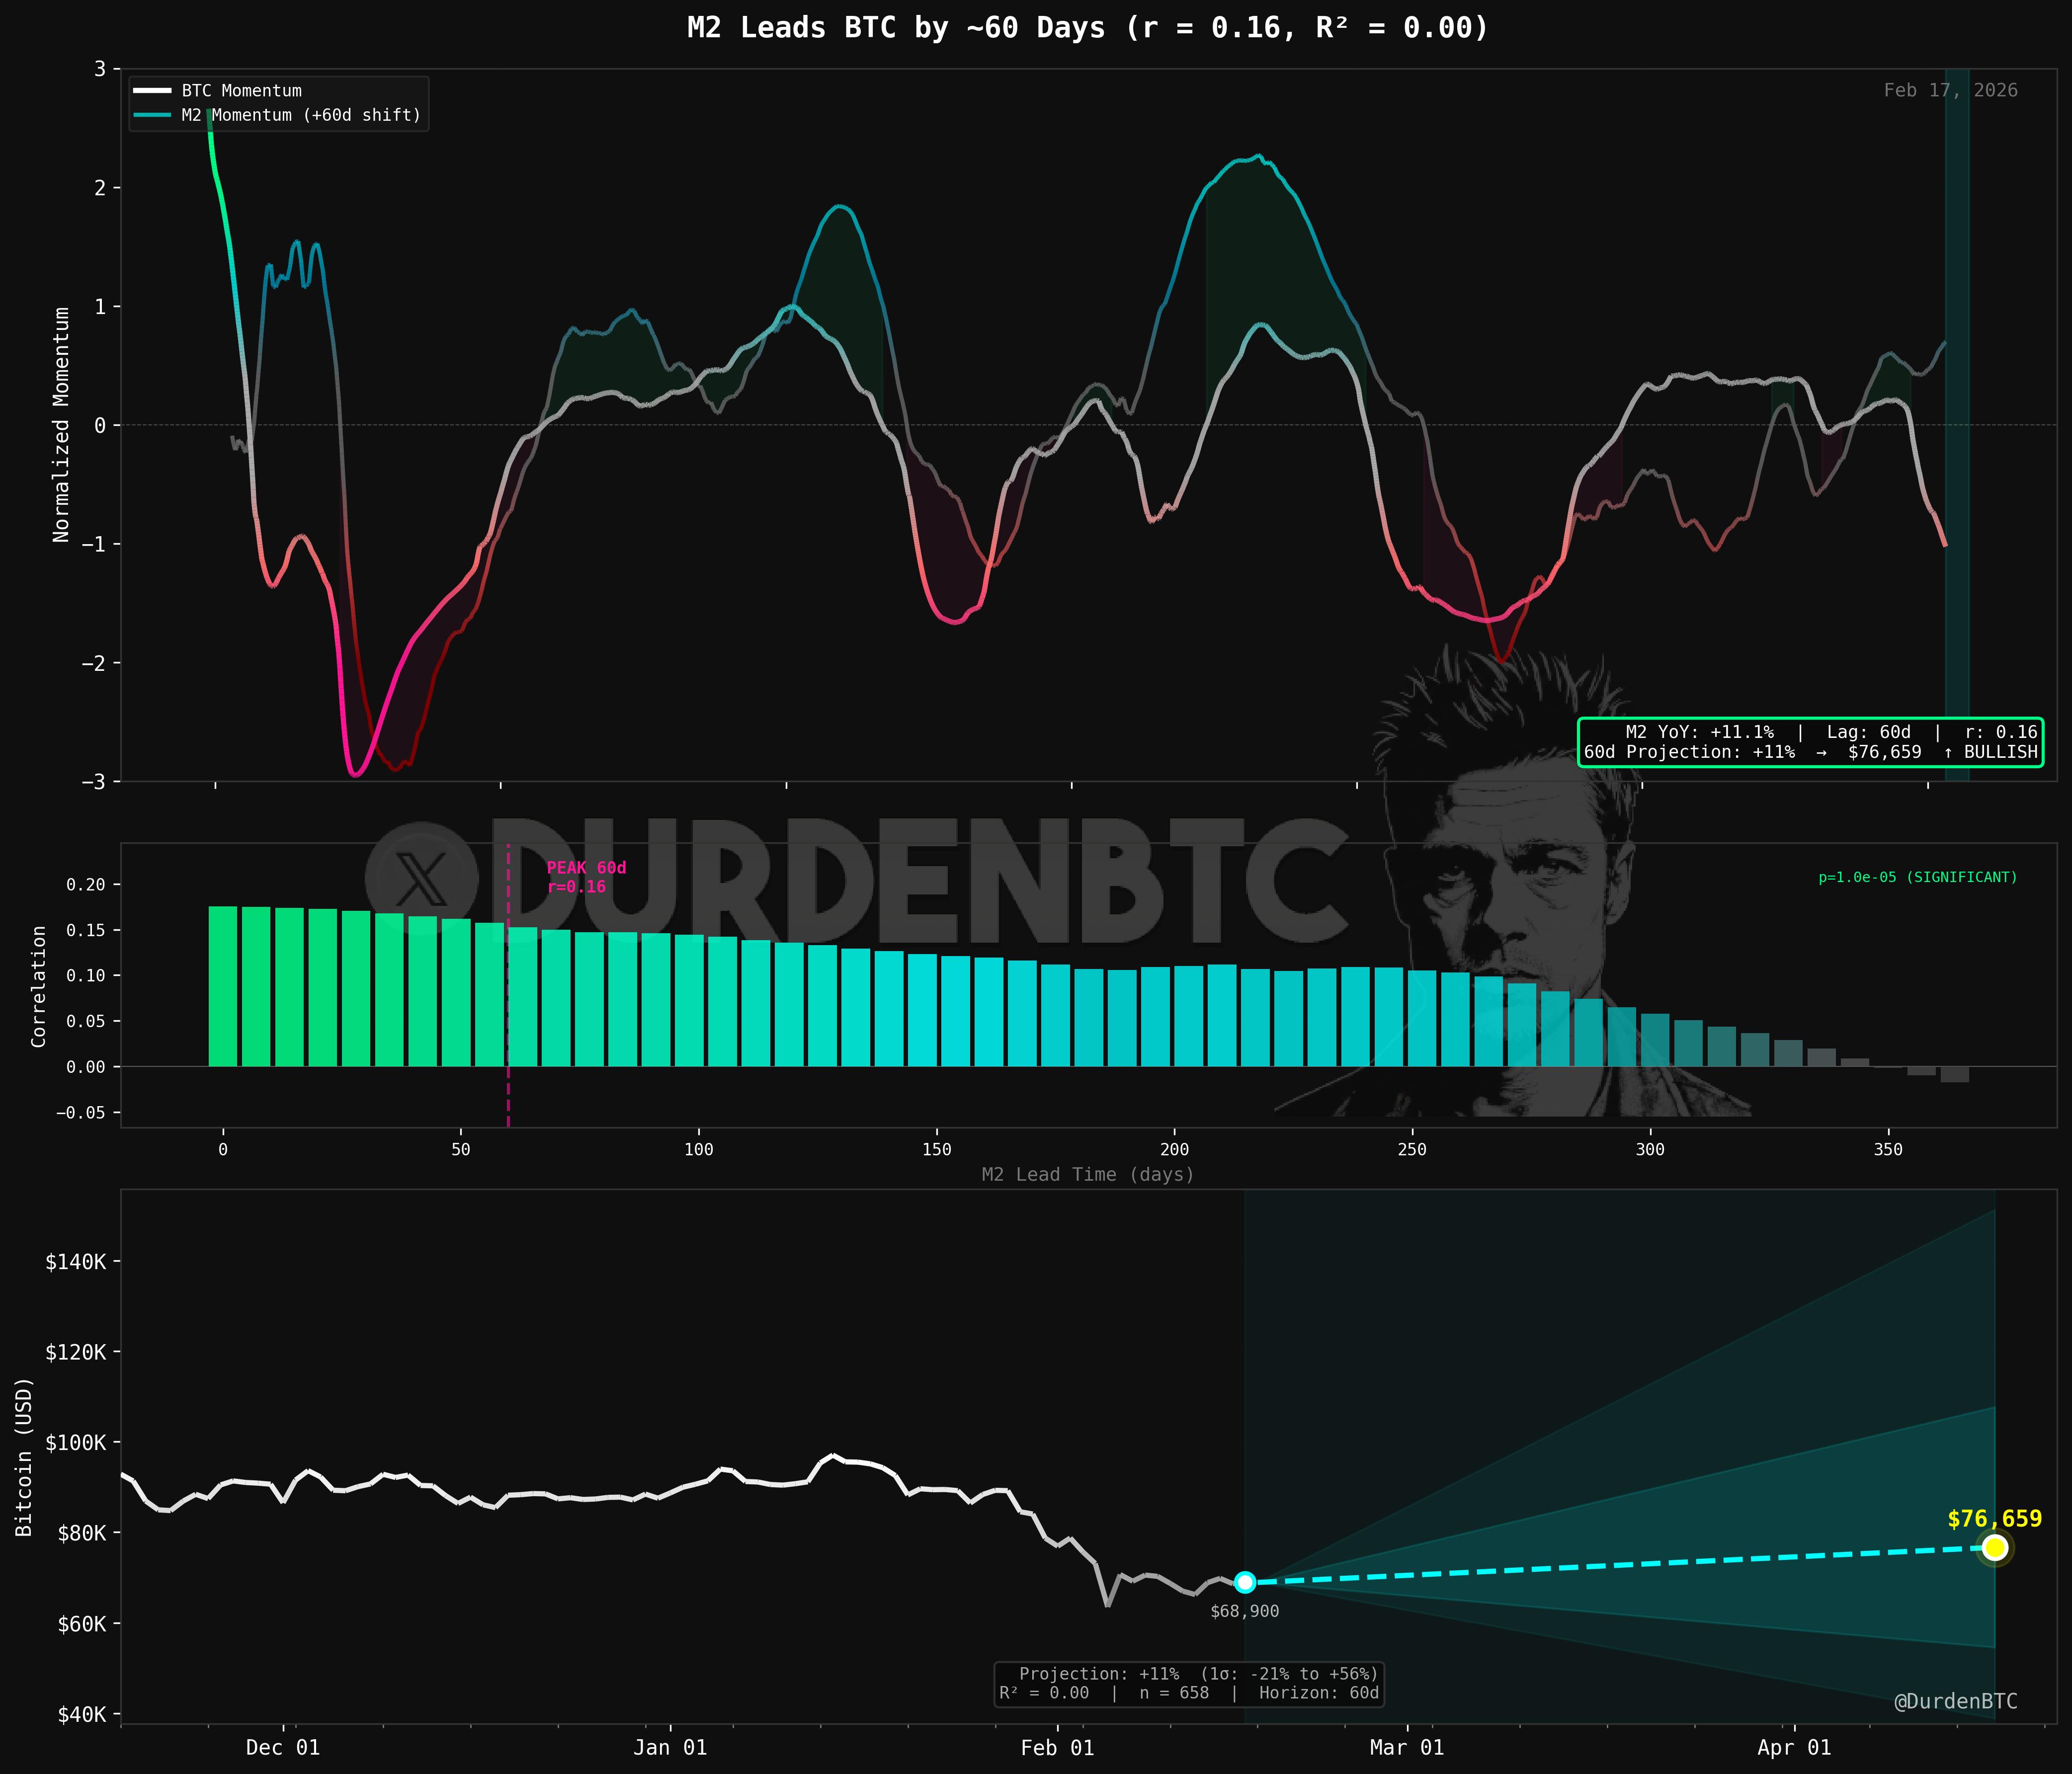
The relationship between global M2 and Bitcoin isn't instant. There's a lag.. and that lag is the entire edge.
When central banks expand M2, the liquidity cascades through the financial system in stages: bank reserves first, then bond markets, then equities, then high-beta risk assets. By the time the flow reaches Bitcoin, 84 to 107 days have passed since the original M2 expansion.
| Lookback Window | Correlation (r) | Signal Quality |
|---|---|---|
| 30-day | 0.40–0.55 | Moderate (noisy) |
| 90-day | 0.65–0.80 | Strong |
| 365-day | 0.80–0.92 | Very Strong |
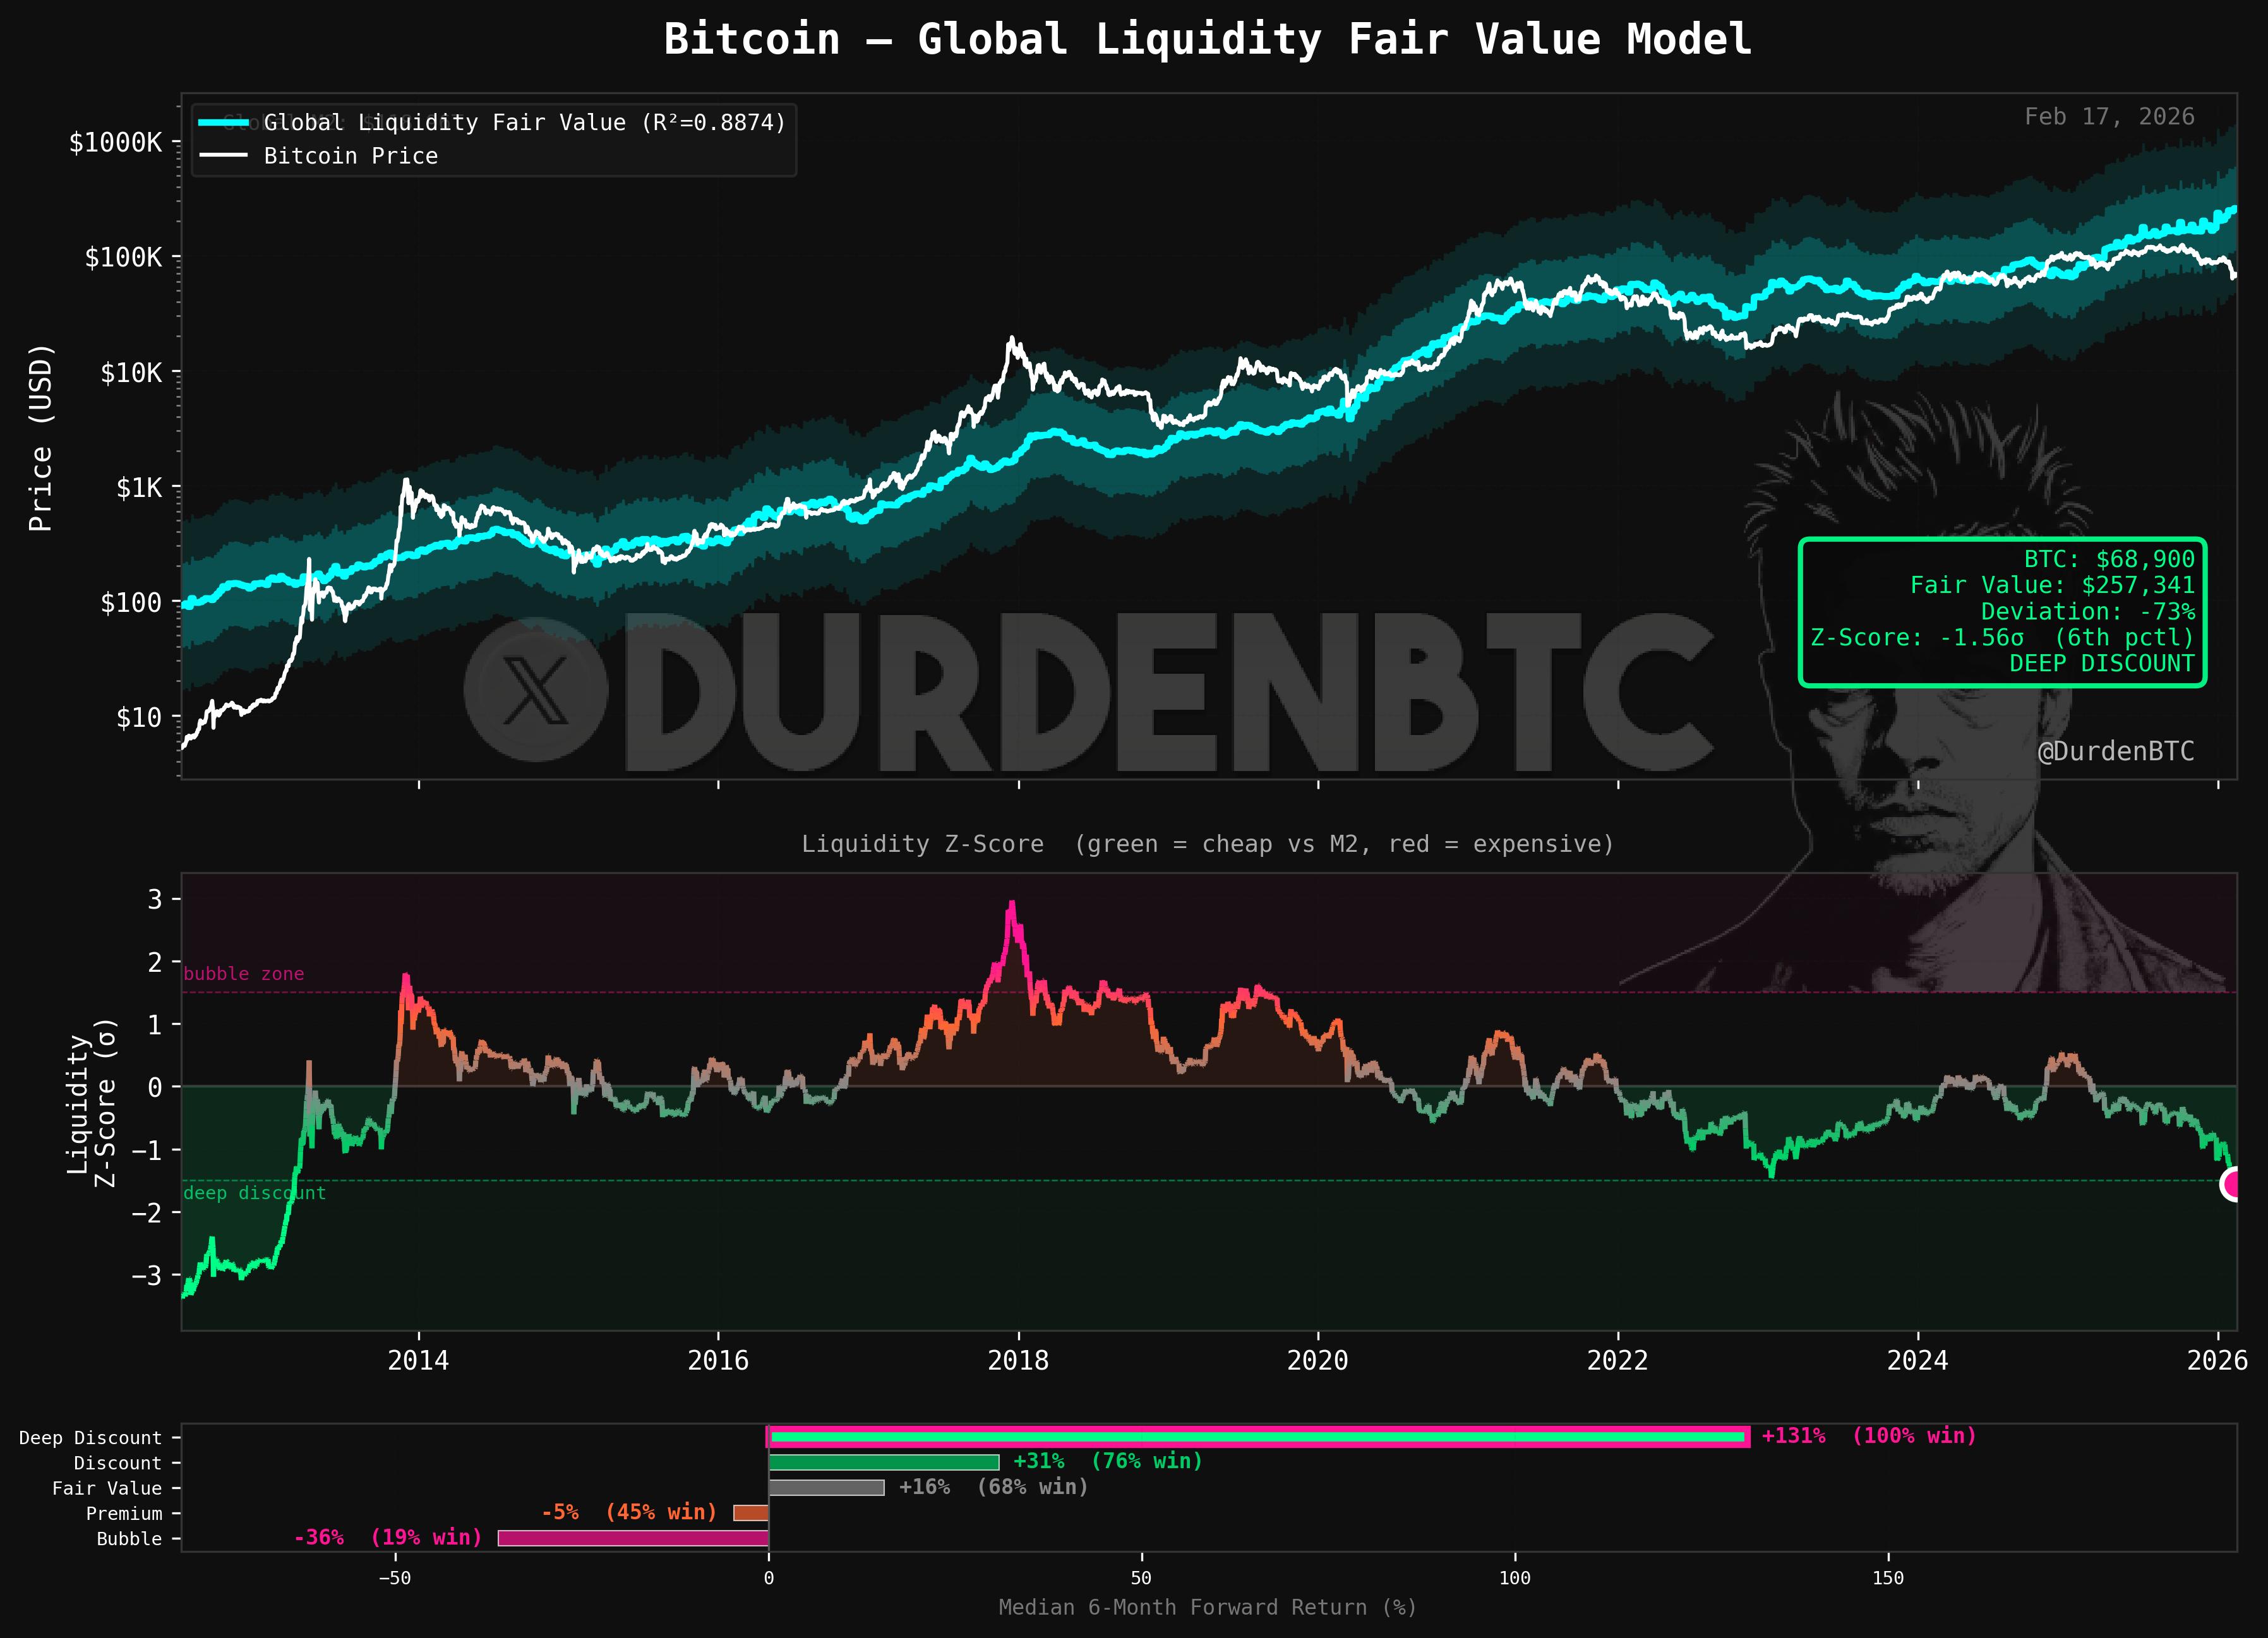
The 30-day correlation is noisy because short-term M2 data includes seasonal adjustments, reporting delays, and FX fluctuations. But zoom out to 90 days or 365 days, and the relationship becomes remarkably tight. Over the long run, Bitcoin tracks global liquidity with near-mechanical precision.
The practical application: shift your M2 chart forward by 84–107 days. Where M2 was pointing three months ago tells you where Bitcoin is heading now. This is exactly what the DurdenBTC Global M2 Liquidity Tracker does on TradingView.. it applies the offset automatically so you can see the leading signal overlaid on BTC price.
Most traders react to price. The M2 framework lets you see the liquidity wave approaching before it hits. You're not predicting.. you're reading the current that's already in motion, 84 days ahead of the crowd.
How to Track Global M2
You can't just add up M2 numbers from different countries. Japan's M2 is in yen. China's is in yuan. Europe's is in euros. If the dollar strengthens 10% against the yen, Japan's M2 shrinks in dollar terms even if the BOJ is printing. This is why FX adjustment is critical.
The DurdenBTC tracker aggregates M2 from 20+ countries and converts each to USD using current exchange rates. This FX-adjusted global M2 is the true measure of how much liquidity is available to flow into dollar-denominated risk assets like Bitcoin.
Normalization Modes
Raw M2 numbers are hard to interpret because the scale changes over time. The tracker offers three modes:
Raw.. the actual dollar figure. Useful for absolute context.
Indexed (base 100).. tracks percentage change from a baseline. Best for trend identification.
Z-Score.. measures how extreme current M2 is relative to its own history. Best for identifying overheated or suppressed liquidity conditions.
For most Bitcoin analysis, Index mode with the 84–107 day offset gives the clearest actionable signal. Z-Score mode is useful for catching inflection points.. when liquidity has been suppressed for an extended period and is starting to turn, that's typically when Bitcoin's most explosive moves begin.
The EMA-89 Regime Filter
Raw M2 data is noisy. Monthly releases, seasonal adjustments, and FX fluctuations create chop that can mislead. The EMA-89 regime filter cuts through it.
The logic is binary: when the M2 composite is above its 89-period EMA, the liquidity regime is Risk-On. Below it, Risk-Off. No gray area. No "maybe." The EMA is long enough to smooth out noise but responsive enough to catch genuine regime shifts within 2–3 weeks.
When global M2 breaks below its EMA-89 for the first time in an extended period, pay attention. This happened in early 2022 before the crypto crash, and in late 2024 before a brief correction. The filter doesn't predict bottoms.. it tells you when the tide is going out. Don't swim against the tide.
The Fibonacci SMAs layered on top provide additional structure. When all five are stacked in order (shortest on top), liquidity is in a strong uptrend. When they tangle and cross, you're in a regime transition. Combined with the macro regime classification, these layers give you a complete liquidity picture.
Regional Breakdown
Not all M2 is created equal. The three heavyweights.. the US Fed, China's PBOC, and the European ECB.. account for the vast majority of global liquidity changes. Tracking their 90-day deltas tells you who's leading the charge.
| Region | Share of Global M2 | Impact on BTC | Typical Behavior |
|---|---|---|---|
| US (Fed) | ~28% | Highest | QE/QT cycles, reserve management, TGA/RRP dynamics |
| China (PBOC) | ~32% | High | Credit impulse, stimulus cycles, FX management |
| Europe (ECB) | ~18% | Moderate | Rate cycles, sovereign debt management, QE programs |
| Japan (BOJ) | ~10% | Lower | Yield curve control, yen dynamics |
China often leads. The PBOC tends to ease ahead of the Fed because China's economic cycle leads the US by 6–12 months. When Chinese M2 starts expanding aggressively, it's frequently a leading indicator for global risk appetite.. and by extension, Bitcoin. The ISM Manufacturing signal provides an additional lens on this growth cycle.
Watch for divergence between regions. When the US is tightening (QT) but China is easing (credit impulse), the net effect on global M2 depends on the magnitude. If China's injection exceeds the Fed's drain, global M2 expands.. even in a "tightening" environment. These cross-currents are where most retail traders get confused and where the composite M2 tracker provides its clearest edge.
Using M2 in Your Framework
Global M2 is powerful, but it's not a standalone signal. It tells you about the environment, not the timing. You need additional layers.
The hierarchy works like this: M2 tells you the current direction. The macro regime tells you the classification. Arsenal BTC's signal stack tells you the Bitcoin entry. And drawdown management keeps you alive through the noise.
| M2 Regime | Macro Regime | Signal State | Action |
|---|---|---|---|
| Expanding | Goldilocks | Arsenal BTC +2 BULLISH | Full position.. highest conviction |
| Expanding | Goldilocks | No signal yet | Wait for entry.. environment is favorable |
| Contracting | Deflation | Any | Cash.. don't fight the tide |
| Expanding | Inflation | Mixed | Caution.. liquidity is rising but regime is hostile |
The highest-conviction Bitcoin trades happen when M2 is expanding, the macro regime is Goldilocks or Reflation, and the trend signals confirm. When all three layers align, that's when you press. When they diverge, you reduce size or sit in cash. This layered approach is what separates a systematic framework from gambling.
Follow the Liquidity
Every macro rally needs liquidity. Every crash is preceded by liquidity drying up. Global M2 is the broadest, most reliable measure of that liquidity, and Bitcoin is its most responsive recipient.
"The market's real engine is liquidity. Everything else is narrative."
Track M2 with the 84–107 day offset. Use the EMA-89 as your binary regime filter. Watch the regional breakdowns for leading signals from China and the Fed. And always, always combine it with the broader macro regime framework before making allocation decisions. The research section has weekly updates on where all of these signals stand.
Live Charts
Free macro regime updates, strategy breakdowns & thesis posts.
Sources
Primary Data
Academic Foundations
Full academic bibliography — DurdenBTC Academic Foundations →