The Cost of Drawdowns
There's a persistent myth that volatility is the "price of admission" to Bitcoin. That you must stomach the drawdowns to earn the returns. That any attempt to manage risk is market-timing, and market-timing doesn't work.
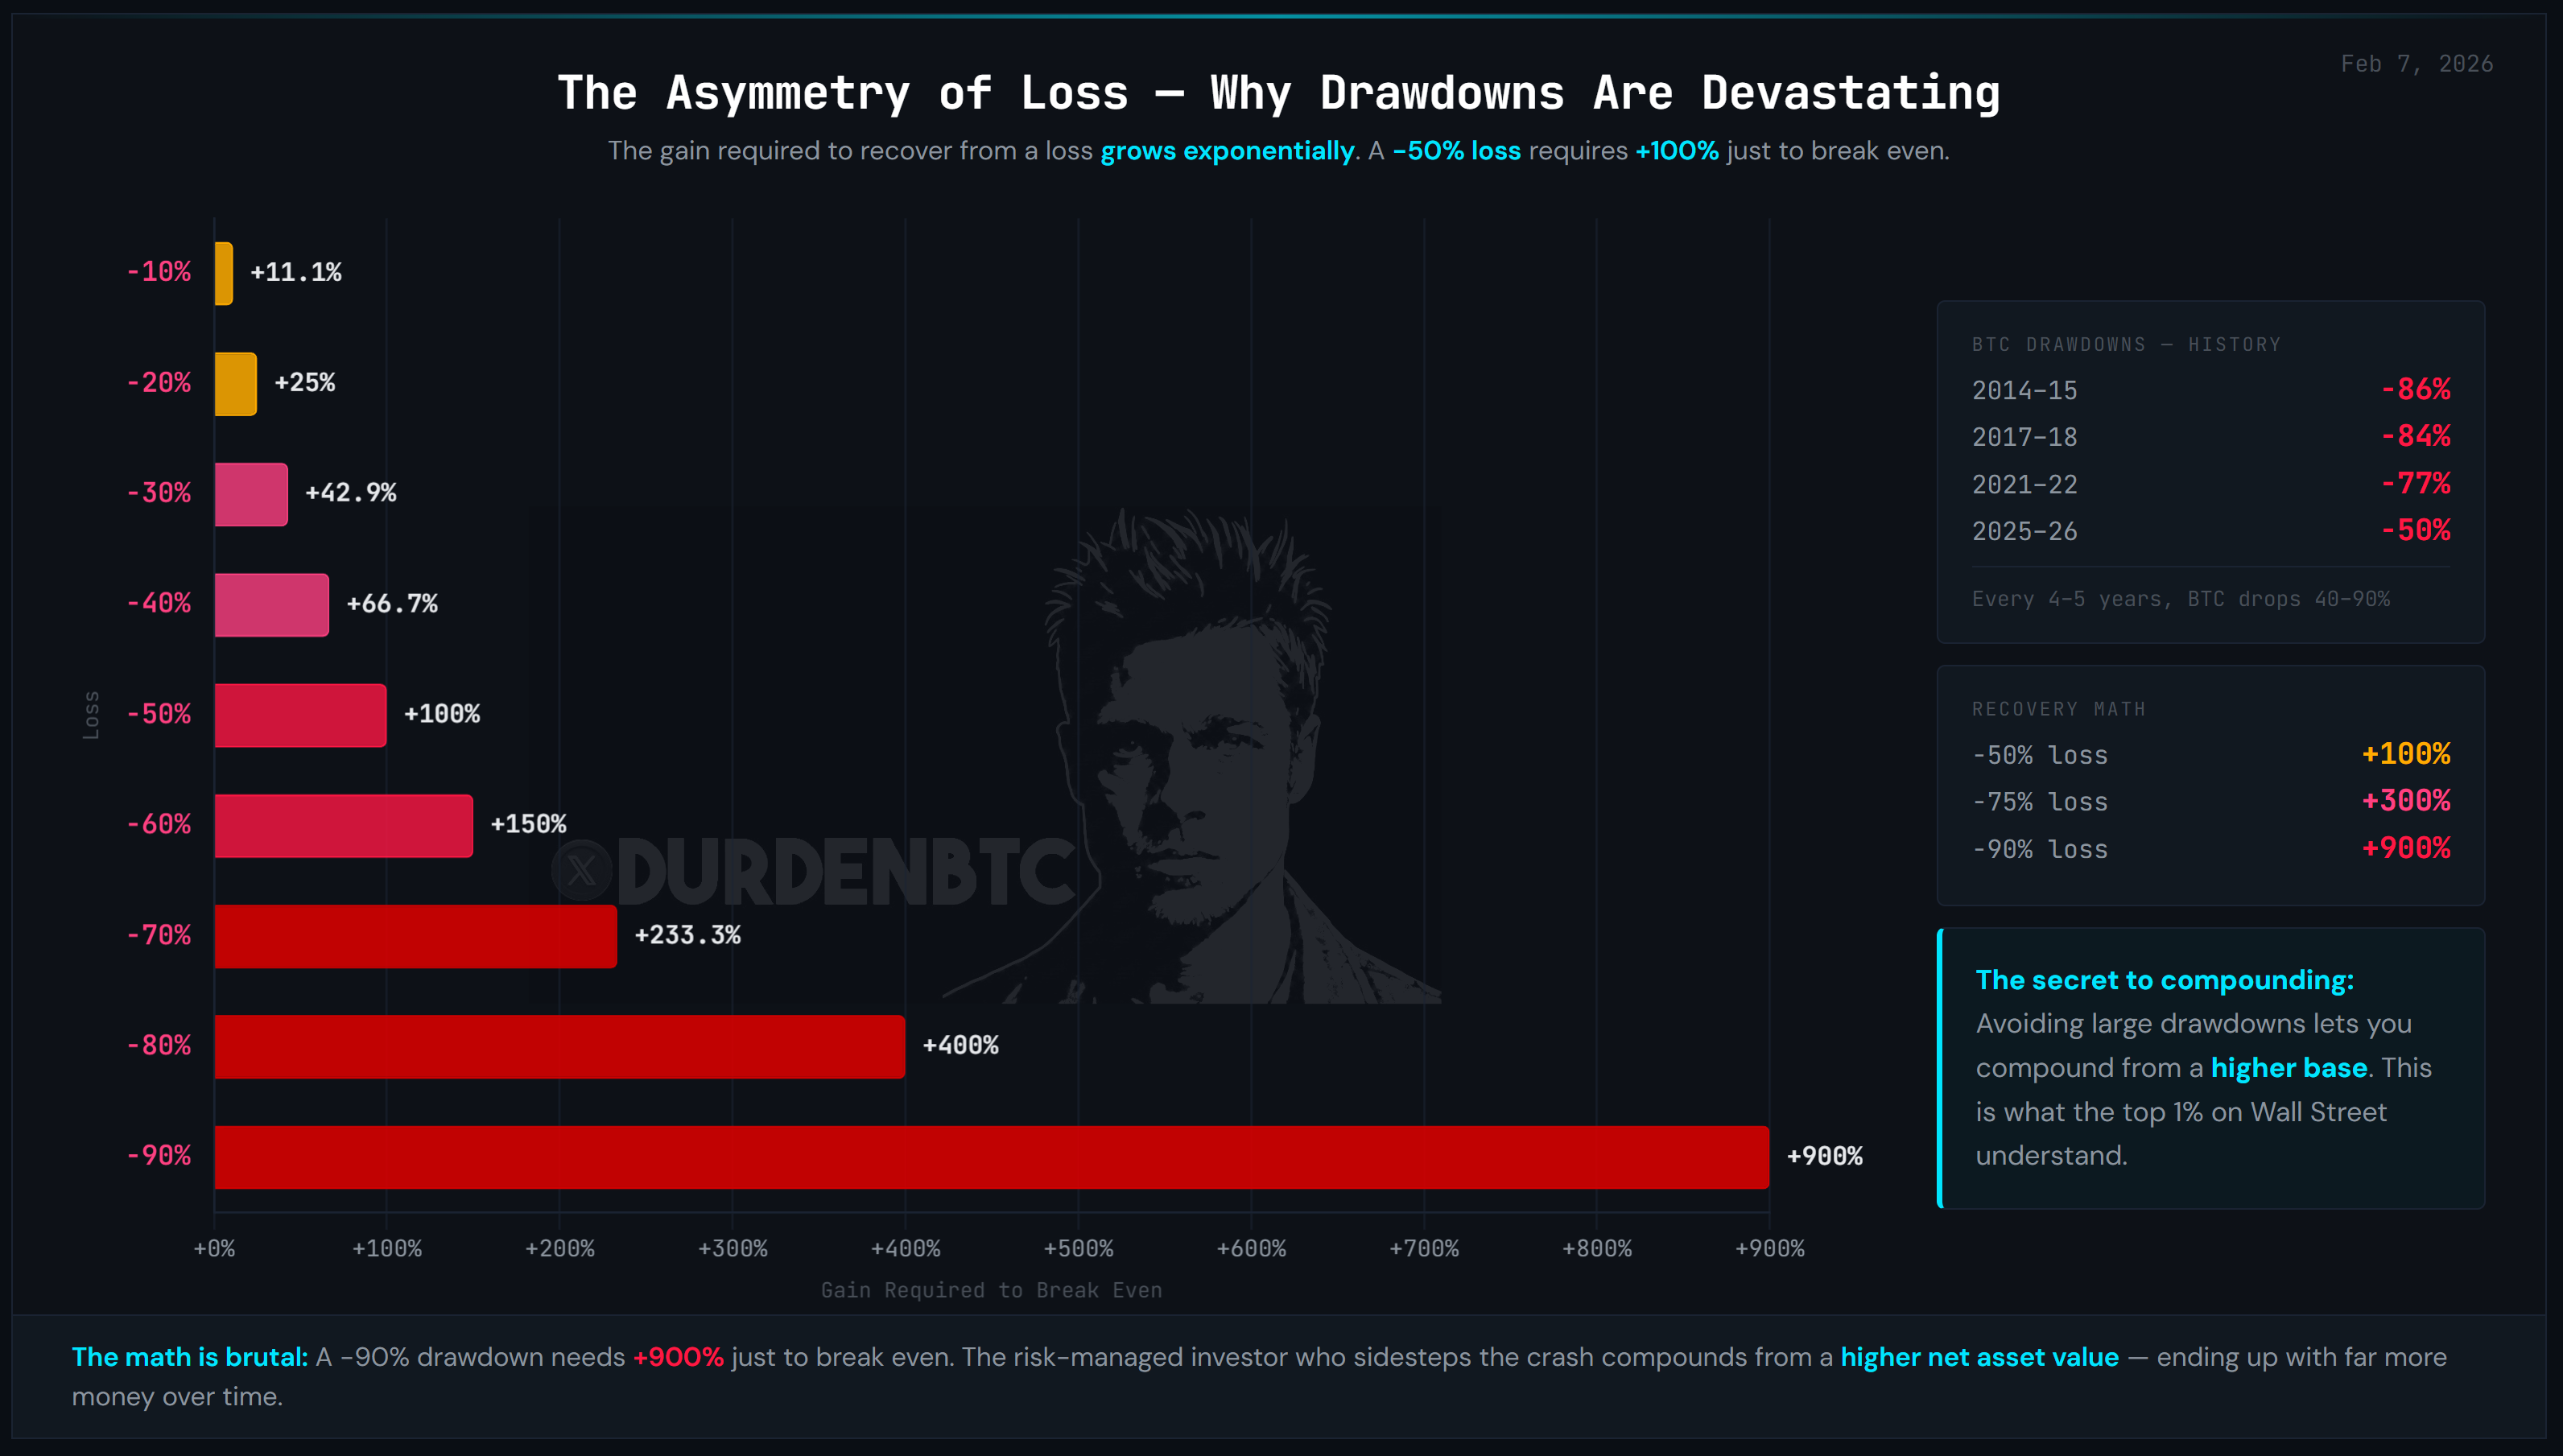
This is mathematically wrong. Losses are asymmetric. The deeper the hole, the more effort required to climb out. And the relationship is non-linear.. it accelerates viciously below -50%.
| Drawdown | Recovery Required | Asymmetry Ratio |
|---|---|---|
| -10% | +11.1% | 1.1× |
| -20% | +25.0% | 1.3× |
| -30% | +42.9% | 1.4× |
| -50% | +100.0% | 2.0× |
| -75% | +300.0% | 4.0× |
| -85% | +566.7% | 6.7× |
| -93% | +1,329% | 14.3× |
Read that last row again. A -93% drawdown.. which Bitcoin experienced in 2011.. requires +1,329% just to break even. Not to profit. Just to get back to where you started. Every dollar that survived that drawdown was compounding from near-zero while the managed dollar was compounding from near its peak. That gap is permanent.
Bitcoin's Drawdown Record
These aren't hypotheticals. This is what Bitcoin actually did.. inside its secular uptrend:
| Year | Drawdown | Recovery Required | Time to New ATH |
|---|---|---|---|
| 2011 | -93% | +1,329% | ~2 years |
| 2014–15 | -85% | +567% | ~3 years |
| 2018 | -84% | +525% | ~3 years |
| 2022 | -77% | +335% | ~2 years |
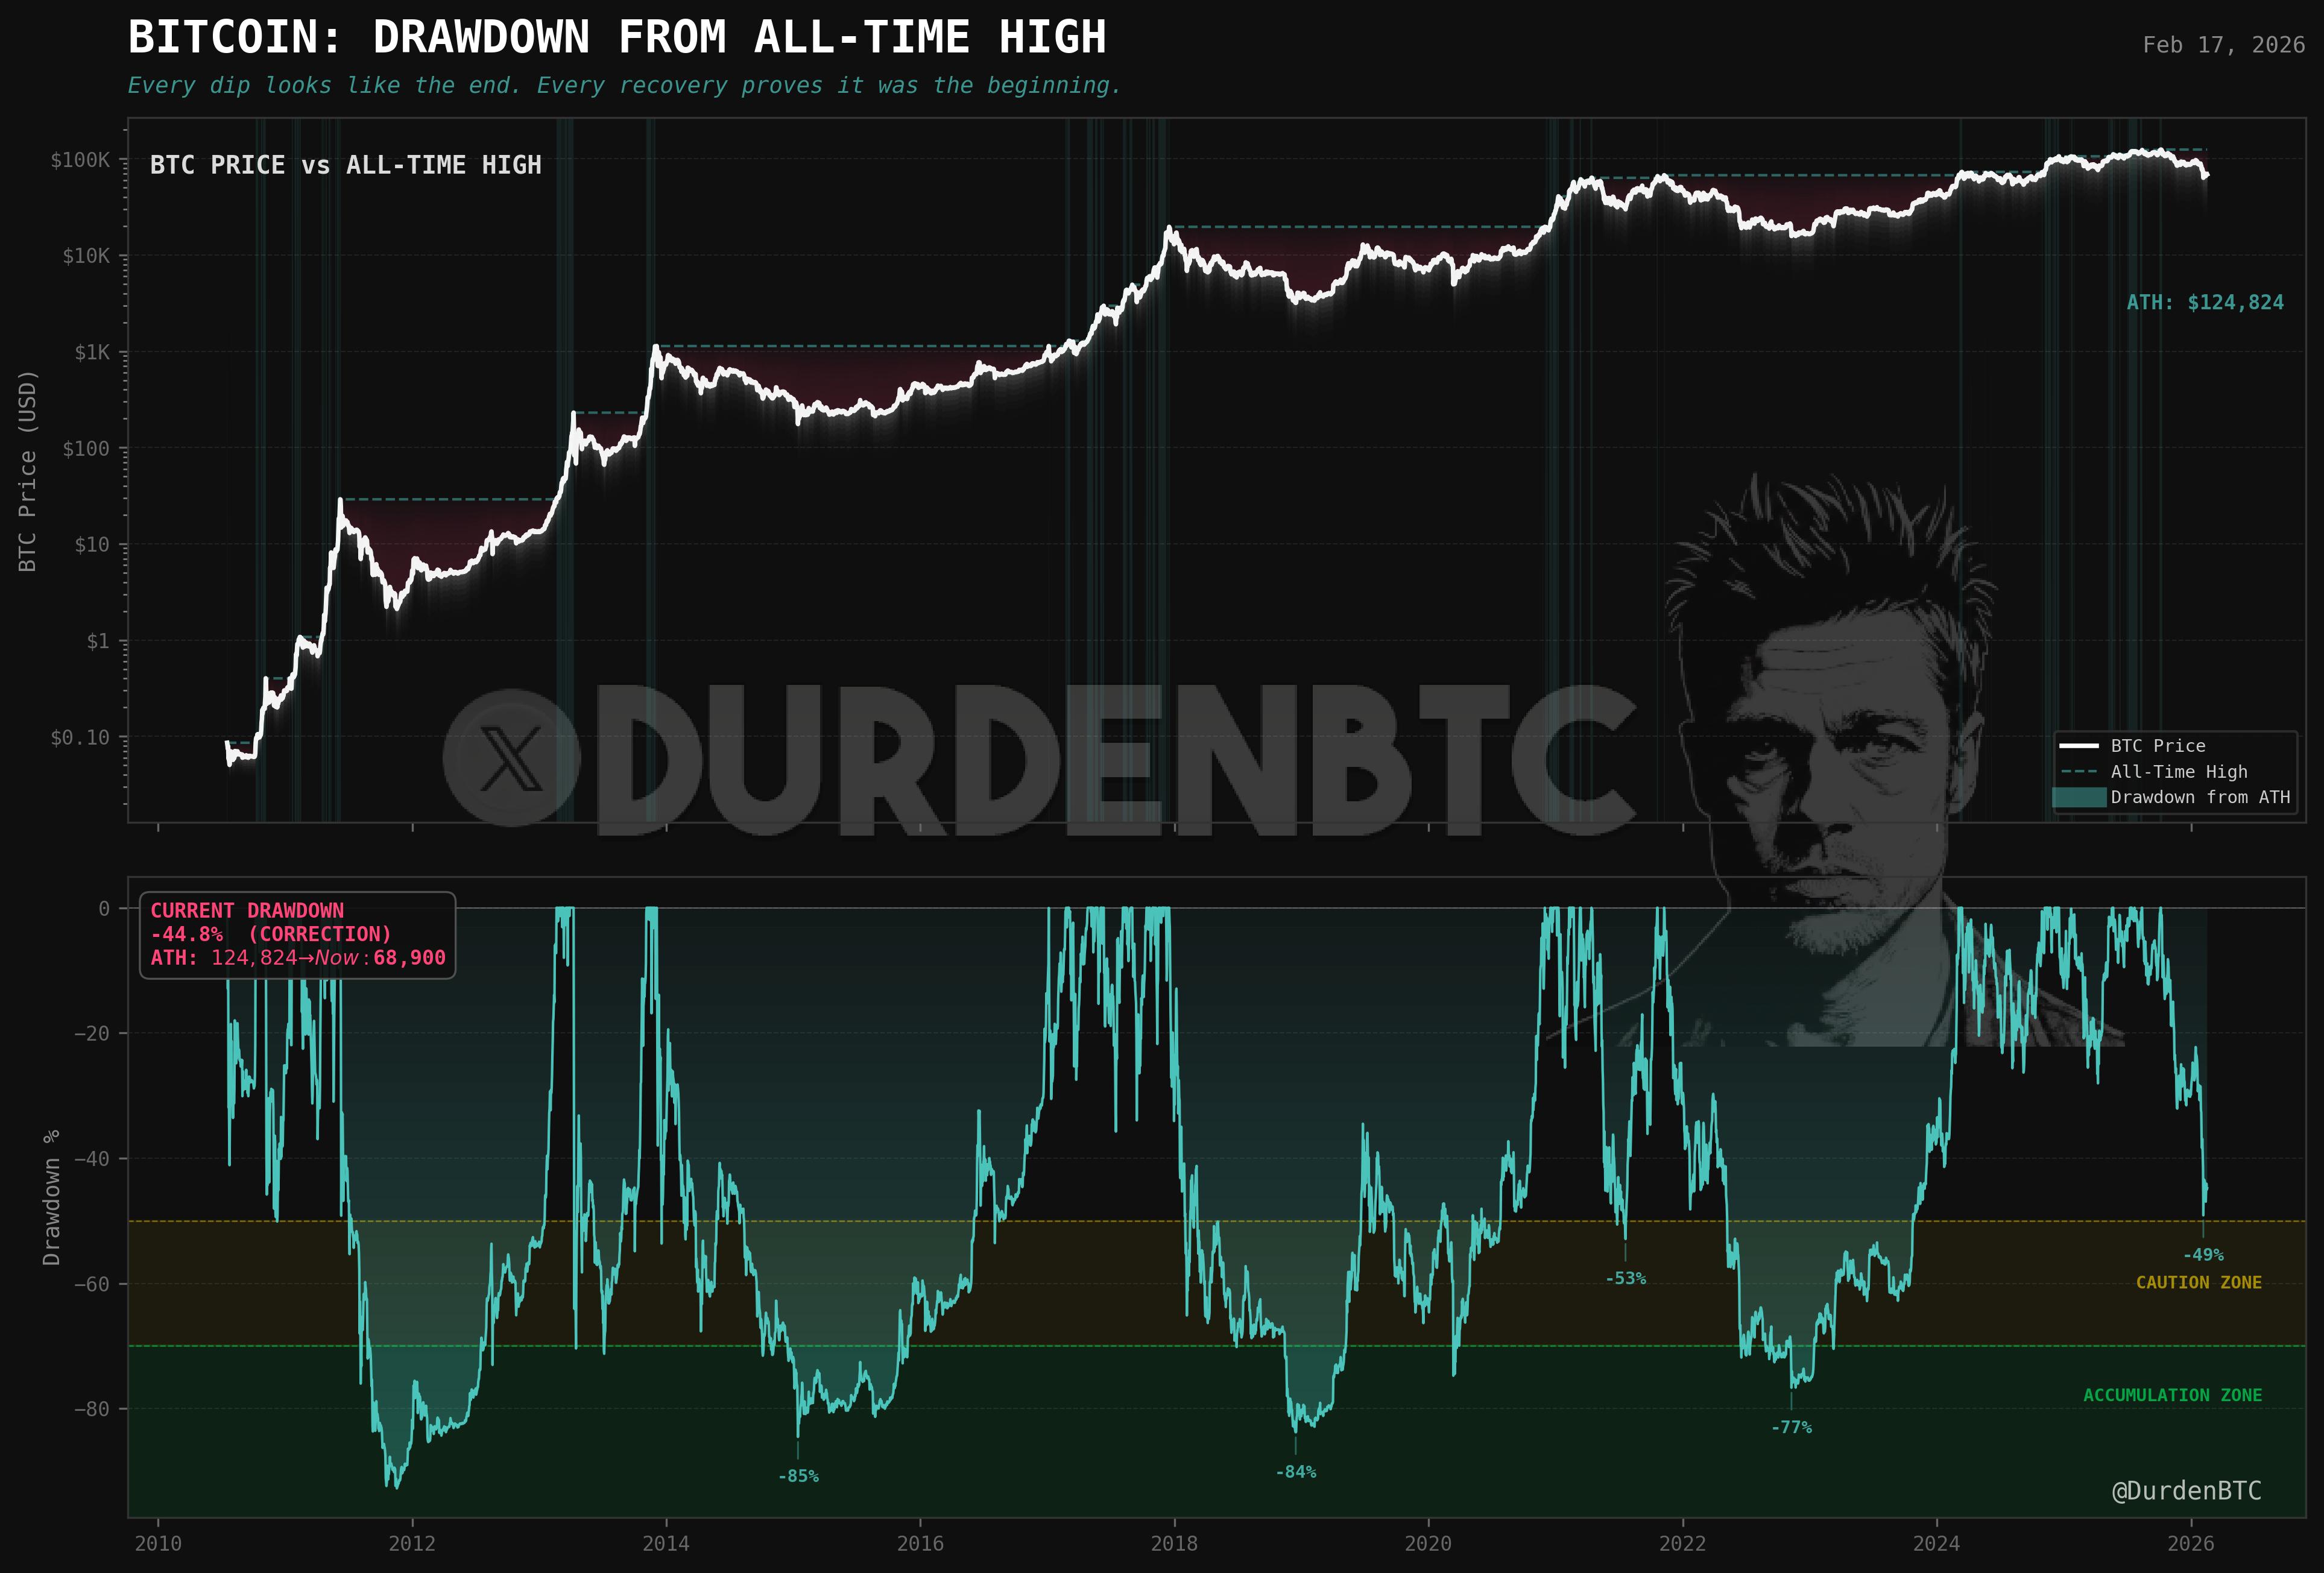
Four times. Four catastrophic drawdowns. Each one occurred inside the secular uptrend that everyone points to as the reason you shouldn't manage risk. The trend didn't prevent them. And each one forced holders to compound from a devastated base for 2–3 years just to get back to breakeven.
A dollar that survived the 2022 drawdown needed to 4.35× itself just to break even. A dollar in a risk-managed portfolio that avoided the drawdown was compounding on its full value the entire time. After the recovery, the managed dollar is still ahead.. permanently.. because it never fell behind.
This is the insight that The Thesis is built on. It's not about capturing more upside per cycle. It's about never compounding from a crater. The buy/sell signal system exists specifically to execute this philosophy with precision.
Volatility Drag
Volatility drag is the hidden wealth destroyer. Two portfolios can have the same average arithmetic return and wildly different terminal values.
A portfolio returning +50%, -40%, +50%, -40% has an average return of +5%/year. But the geometric return.. what you actually earn.. is -5.1%/year. The volatility consumes the entire return and then some. This is volatility drag.
The mechanism is simple: after every drawdown, you're compounding from a lower base. A +50% gain on $100 gives you $150. A -40% loss on $150 gives you $90. You started at $100, earned an "average" of +5%, and you're down $10. Repeat this over multiple cycles and the drag compounds just as brutally as the returns were supposed to.
Now apply this to Bitcoin, where the drawdowns aren't -40%.. they're -75% to -93%. The volatility drag in an unmanaged Bitcoin position across a full cycle is catastrophic. The only thing that saves buy-and-hold Bitcoin investors is that the secular uptrend has been powerful enough to overcome the drag. So far.
"The sequence of returns matters more than the average of returns."
Compounding is path-dependent. The order in which returns arrive determines the terminal value. A -75% early in the sequence is catastrophically more damaging than the same -75% late, because it destroys the base upon which all future gains compound. This is why systematic trend following generates more terminal wealth.. not by capturing more upside, but by protecting the compounding base.
Risk-Managed vs. Unmanaged
Steady gains, no drawdowns.
Compounding on a growing base.
Higher peaks, deeper valleys.
Compounding from a crater.
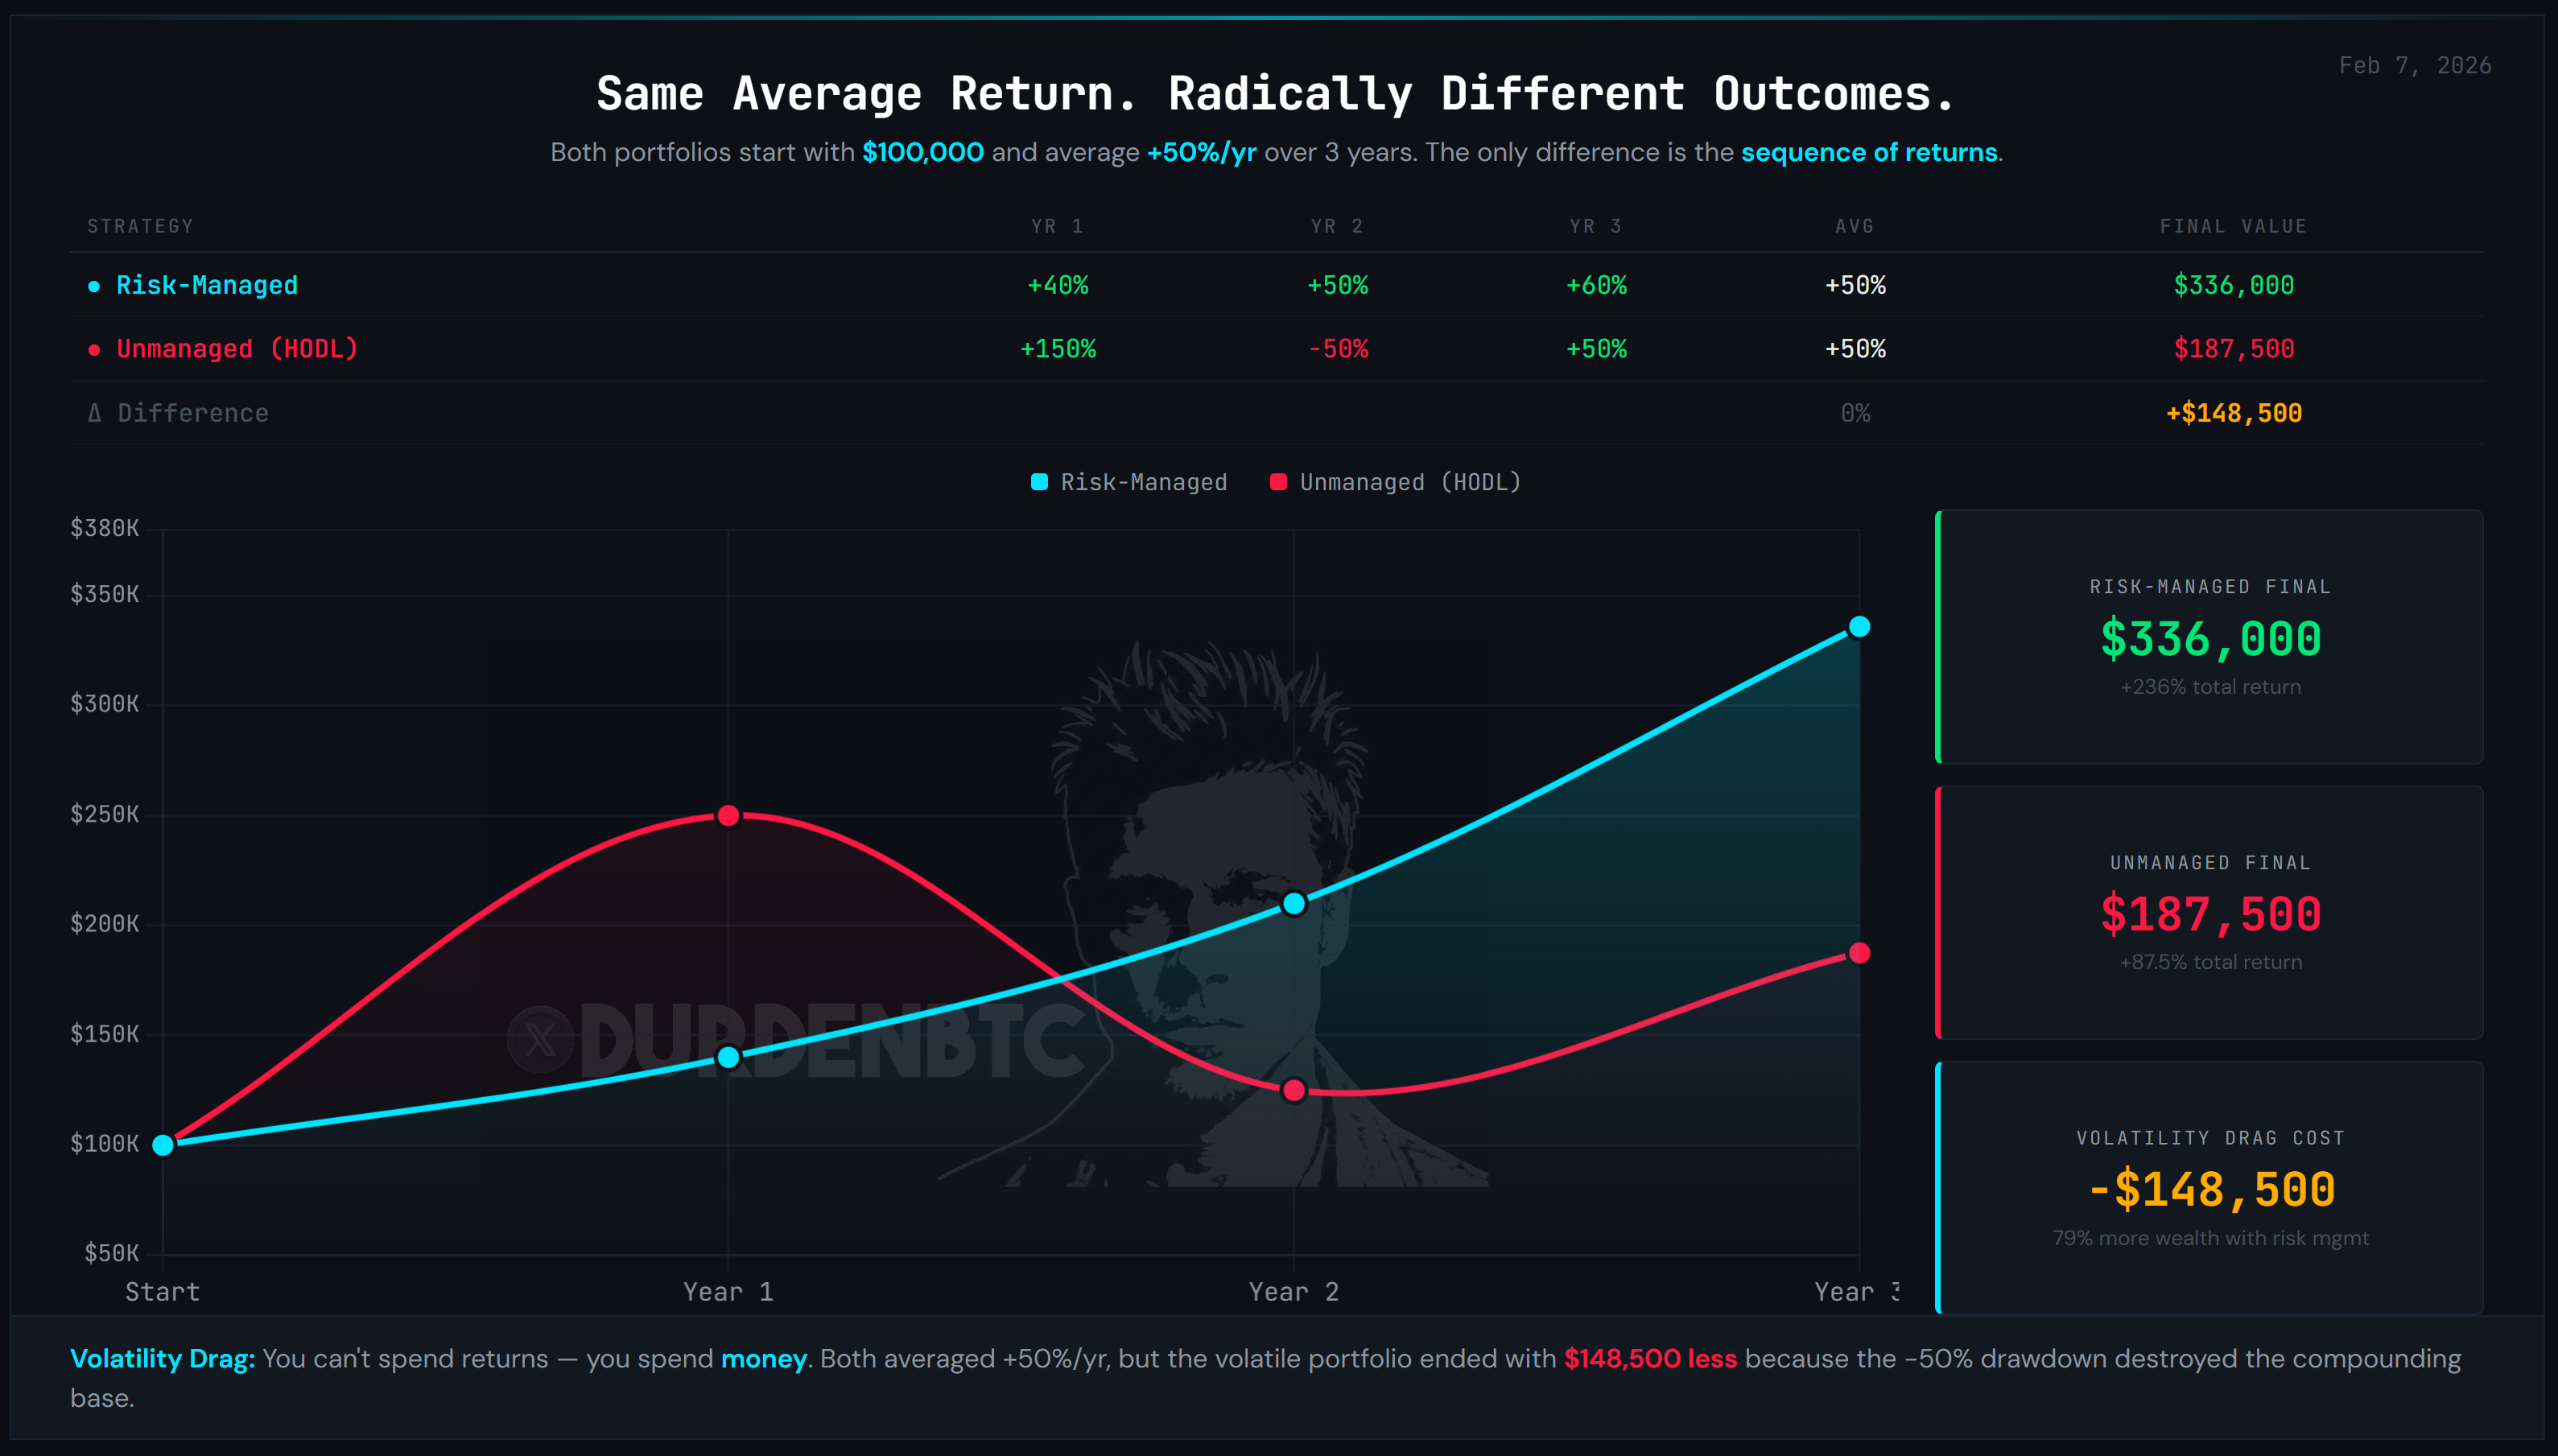
Same asset class. The unmanaged portfolio had a higher peak ($250K vs. $210K). But the -50% drawdown forced it to compound from $125K instead of $210K. By Year 3, the risk-managed portfolio leads by $149K.. a 79% advantage.. not because it captured more upside, but because it avoided compounding from a devastated base.
MRE v06: +925.8% · CAGR: 10.52% · Sharpe: 0.96 · Max DD: −16.22%
Buy & Hold SPY: +679.4% · CAGR: 9.22% · Max DD: −56.47%
MRE v06 beat buy-and-hold by 246 percentage points cumulatively while spending 30% of trading days in cash.. precisely the days that produced the buy-and-hold drawdowns. Seven independent forward tests passed.
The "Just Size Down" Myth
The typical advice: "If you can't handle the volatility, reduce your position size." This sounds sensible. It is not.
If you size down your position enough to emotionally tolerate a -75% drawdown, you've also sized down your exposure to the upside by the exact same proportion. You've traded volatility drag for opportunity cost. The wealth destruction is just happening through a different mechanism.
Say you size Bitcoin at 10% of your portfolio to "manage risk." A -75% BTC drawdown only costs you -7.5% at the portfolio level.. survivable. But a +300% BTC rally only adds +30% to your portfolio. You've neutered the return to manage the pain, when you could have kept the full allocation and managed the drawdown directly.
Keep the position meaningful. Manage the tail risk directly. Arsenal BTC manages Bitcoin exposure with a −34.46% max drawdown vs buy-and-hold’s −83.40%.. because the system de-risks (50% or 0%) when trend or vol deteriorates. Full upside exposure, truncated downside. No need to size down.
Two Engines, One Philosophy
The philosophy is asset-agnostic. The implementation is asset-specific.
For equities (SPY): MRE v06 polls 26 voters across equities, breakevens, the yield curve, FX, credit, and commodities to classify the macro regime. If the environment is hostile, it holds cash. CAGR 10.52%. Sharpe 0.96. Max DD −16.22% vs buy-and-hold's −56.47%. Seven forward tests passed.
For Bitcoin: Arsenal BTC uses VAMS.. a trend filter (SMA crossover) plus a three-layer volatility regime filter.. with three-state positioning (100% / 50% / 0%) mapped to BULLISH / NEUTRAL / BEARISH. CAGR 87.75%. Sharpe 2.32. Max DD −34.46% vs buy-and-hold's −83.40%. Three of four forward tests pass; the OOS walk-forward verdict is honestly disclosed as WEAK.
The 8th Rule remains available as the legacy aggressive Bitcoin alternative for subscribers who prefer it.. CAGR ~65.5%, max DD −24.1% (close-to-close), built on GVTS + VATS with 25%→100% asymmetric sizing.
Both flagship engines share the same DNA: measure the environment, size the position to the strength of the signal, cut the losers fast, and let the winners run. The multi-asset portfolio that combines them with Gold and Ethereum delivers strong risk-adjusted returns relative to traditional 60/40. Forward-tested results are documented on the forward-testing page.
Survival Wins
"You don't need to capture more upside per cycle. You need to avoid the catastrophic losses that destroy compounding."
Every dollar that survives compounds forever. Every dollar that drowns in a drawdown compounds from zero. Drawdown management isn't a defensive strategy.. it's the highest-alpha strategy in existence because it preserves the base upon which all future returns compound.
Truncate the left tail. Accept a modest right-tail cost. Let the math do the rest. For the full mathematical thesis, start there. For the implementation, read about the Bitcoin signal systems (Arsenal BTC + the legacy 8th Rule), the VATS indicator (legacy 8th Rule architecture), or the stress indicators that feed the framework.
Live Charts
Free macro regime updates, strategy breakdowns & thesis posts.
Sources
Primary Data
Academic Foundations
Full academic bibliography — DurdenBTC Academic Foundations →