Why Most Bitcoin Signals Fail
Most trend-following systems on Bitcoin fail for one of two reasons:
Too fast → death by whipsaw. Short-period moving average crossovers (20/50 EMA, MACD, etc.) catch every trend early.. but they also trigger on every 3-day fakeout. On an asset that routinely moves 10–15% in a week and reverses, a fast system churns through your equity in commission and slippage. You end up buying the top of a bounce and selling the bottom of a dip, repeatedly.
Too slow → death by lag. Long-period systems (200-day MA, weekly crossovers) eliminate whipsaw but enter so late that you miss the first 30–40% of a move and exit so late that you give back 20–30% of the peak. On a 300% bull run, you capture maybe 150%. On a 70% bear market, you eat the first 25% before the signal fires.
Every single-signal system forces you to choose between speed and accuracy. Fast signals bleed you to death on noise. Slow signals bleed you on lag. Either way, you underperform buy-and-hold on a long enough timeline because BTC's secular trend is so aggressive that being out of position for even a few weeks during a parabolic move is catastrophic.
Two systems on this site solve this problem from different angles. Arsenal BTC.. the current flagship.. uses a single composite signal (VAMS) with three-state positioning (100% / 50% / 0%) to stay engaged through ambiguous regimes without committing fully. The 8th Rule.. the legacy aggressive alternative.. uses two signals (GVTS + VATS) with asymmetric 25%→100% sizing to ramp into conviction. Same problem, two different answers. The rest of this guide explains both.
VAMS — Trend + Vol Regime
Arsenal BTC's core signal is called VAMS.. a composite of two factors that combine into a single vote of −2, 0, or +2, mapped directly to a 100% / 50% / 0% position. The signal architecture is shared across the Arsenal family (SPY, ETH, Gold), with parameters tuned to each asset's native volatility profile.
"Bitcoin's biggest drawdowns are not slow trend reversals.. they're vol spikes. Filter for vol and the trend signal stops giving back gains in flash events."
Factor 1: Trend Filter (SMA Crossover)
A short-period simple moving average crossed against a longer-period one. If the short SMA is above the long SMA, the trend factor votes +1; if below, it votes −1. Standard trend-following plumbing.. nothing exotic, and that's the point. The edge isn't in the trend filter itself; it's in what gates it.
Factor 2: Three-Layer Volatility Regime Filter
Layer 1.. calm-bull detector: close-to-close volatility measured against its rolling mean. Friendly when realised vol is below the long-run normal.
Layer 2.. calm-bear detector: short-window vol relative to long-window vol with hysteresis to avoid whipsaw. Friendly when the ratio confirms a stable bear, hostile when vol is climbing.
Layer 3.. crisis detector: Parkinson high-low volatility spike against its rolling distribution. Catches the vertical spikes (FTX, May 2021, COVID) that close-to-close vol misses.
The three layers combine into a single read: vol environment is either friendly or it isn't.
Combination Rule (Three States)
+2 (trend up AND vol friendly) → 100% long.
0 (mixed: trend up but vol hostile, OR trend flat) → 50% long.
−2 (trend down regardless of vol) → 0%, in cash.
The middle state matters. Choppy regimes.. where neither trend nor vol fully wins.. are common in BTC. Forcing a binary call in those periods either misses upside (always cash) or eats whipsaw (always long). The half-position keeps capital working without committing fully.. a deliberate compromise, not a hedge.
Reading the Three States
| VAMS Vote | Label | Position | Meaning |
|---|---|---|---|
| +2 | BULLISH | 100% | Trend is up AND vol regime is friendly. Hold spot Bitcoin at full size. |
| 0 | NEUTRAL | 50% | Trend or vol is mixed. Half-position keeps capital engaged with risk dialled back. |
| −2 | BEARISH | 0% | Trend is breaking, vol is in crisis, or both. Sit out until the next cycle. |
Backtest — Arsenal BTC v2 (2015–2026)
| Metric | Arsenal BTC | BTC Buy & Hold |
|---|---|---|
| Annualised Return | +87.75% | +72.73% |
| Sharpe Ratio | 2.32 | 1.09 |
| Max Drawdown | −34.46% | −83.40% |
| Calmar Ratio | 2.55 | 0.87 |
| Total Return | +78,930% | +32,563% |
| Position Sizing | Three-state (100/50/0%) | 100% |
| Trades / Year | 20.2 | — |
| Period | 2015–2026 (10.6 yrs) | 2015–2026 |
Arsenal BTC's OOS walk-forward verdict is honestly disclosed as WEAK.. train Sharpe 2.93 dropped to 1.55 on the test window (which happened to be the 2022–2024 BTC bear). Three other tests (Monte Carlo, parameter sensitivity, crisis stress) pass cleanly. We disclose the weak result because that's what forward-testing is for. Full per-test detail on the forward-testing page.
The headline isn't the +78,930%.. buy-and-hold did +32,563% just by sitting in BTC. The headline is the drawdown gap (−34% vs −83%) and the Sharpe gap (2.32 vs 1.09). Arsenal BTC captured most of Bitcoin's upside while cutting drawdown by more than half. The 20.2 trades per year reflects the higher native volatility of BTC compared to SPY.. the system flips more often because Bitcoin's regimes change more often.
For full architecture detail and the live signal state, see the Arsenal BTC product page. For the forward-test methodology and results, see the forward-testing page.
GVTS + VATS — The Aggressive Path
The 8th Rule is our older, more aggressive Bitcoin system. It's been demoted from flagship to legacy aggressive alternative for subscribers who prefer higher turnover and a more active stance. The architecture below is unchanged from when it shipped.. it works, it has a 12-year track record, and it remains available. But Arsenal BTC is the current flagship for most subscribers.
The 8th Rule uses two distinct signals running at different speeds, plus an asymmetric 25%→100% position-sizing ramp. It trades more often than Arsenal BTC and is calibrated for subscribers who want maximum capture during confirmed trends.
The Fast Signal: GVTS (Gaussian Volatility Trend Signal)
GVTS is the system's first responder. Its job: identify trend flips as early as possible while filtering out noise. It does this through a five-stage signal processing chain.
Stage 1.. HMA Smoothing: Raw price passes through a Hull Moving Average (HMA). The HMA has approximately half the lag of an equivalent-period SMA while being significantly smoother than an EMA.
Stage 2.. Gaussian Filter: The HMA output feeds into a custom Gaussian kernel filter.. a weighted convolution where weights follow a bell curve. Unlike moving averages that weight bars equally, the Gaussian filter naturally de-emphasizes outliers. A single 20% crash day contributes almost nothing to the filtered signal.
Stage 3.. Volatility Envelopes: Two dynamic bands wrap around the Gaussian line. ATR Envelope adapts to current volatility conditions; SD Envelope measures statistical significance of the move.
Stage 4.. EMA Confluence: An EMA(45) applied to the momentum oscillator requires both the trend to be bullish and momentum to be accelerating. This catches the moment when a bullish trend starts losing steam.. even if price hasn't technically broken down.
Stage 5.. Regime Thresholds: Asymmetric regime thresholds.. the bear threshold is significantly larger than the bull threshold. Easier to declare a bear regime than a bull one. Quick to protect, slow to commit.
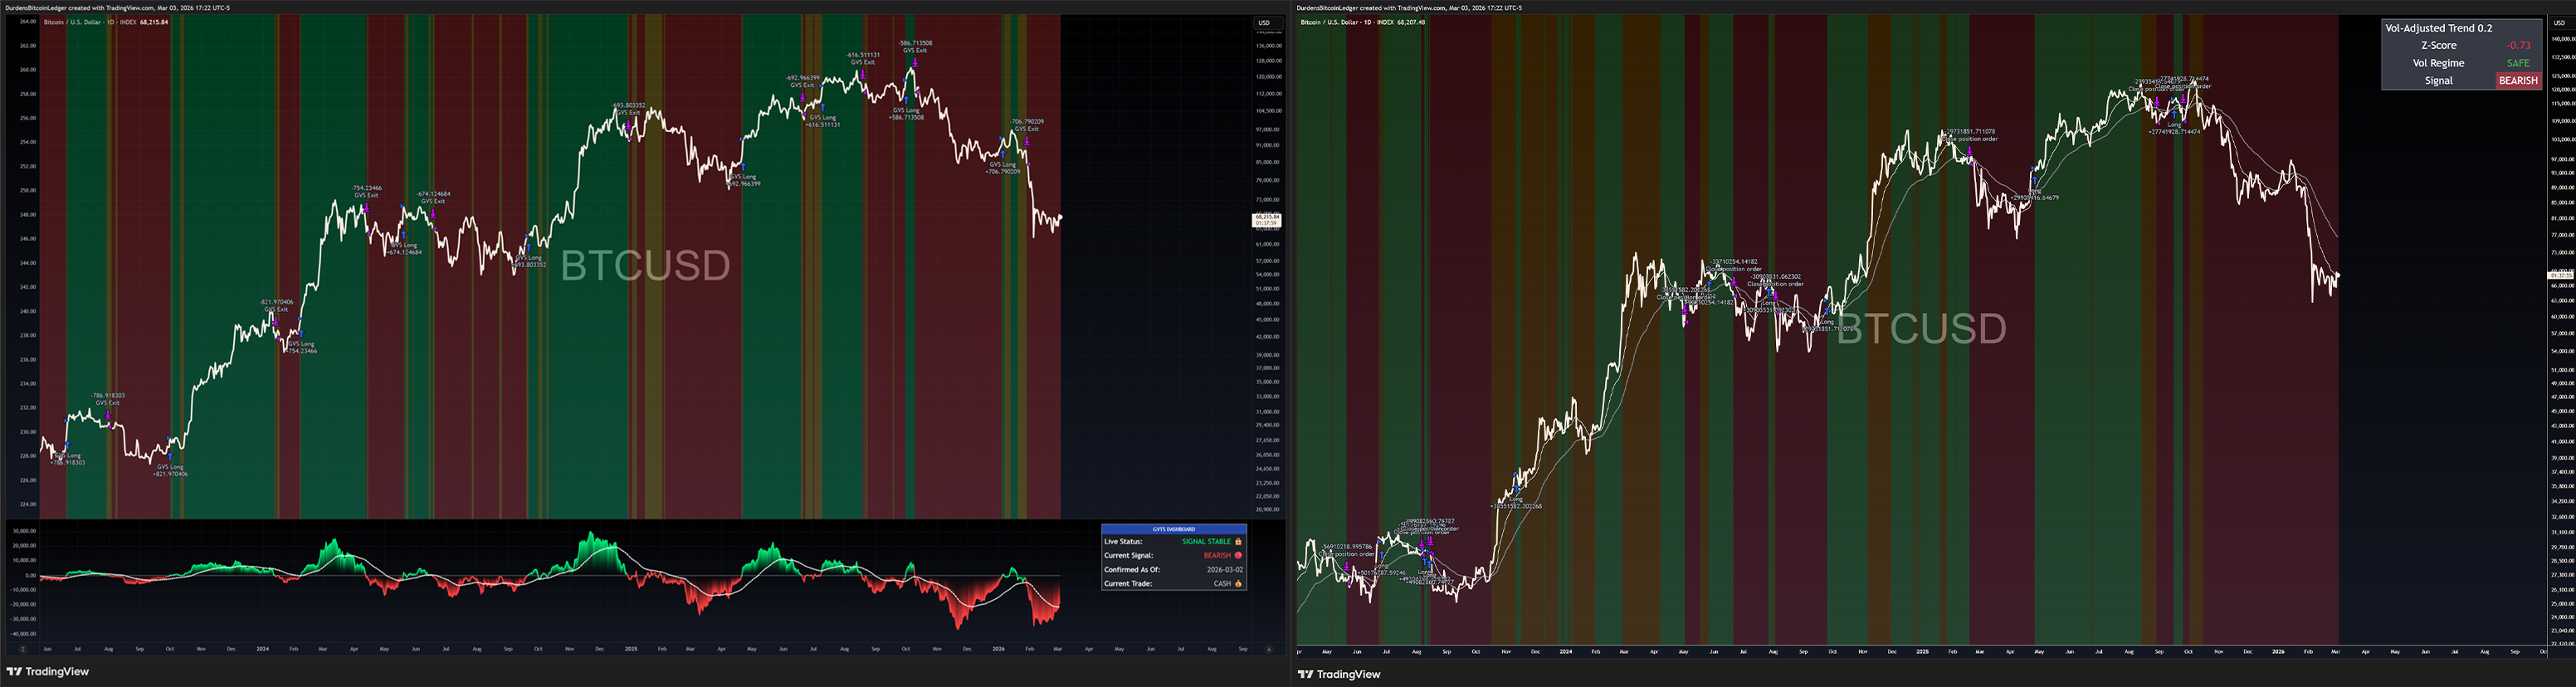
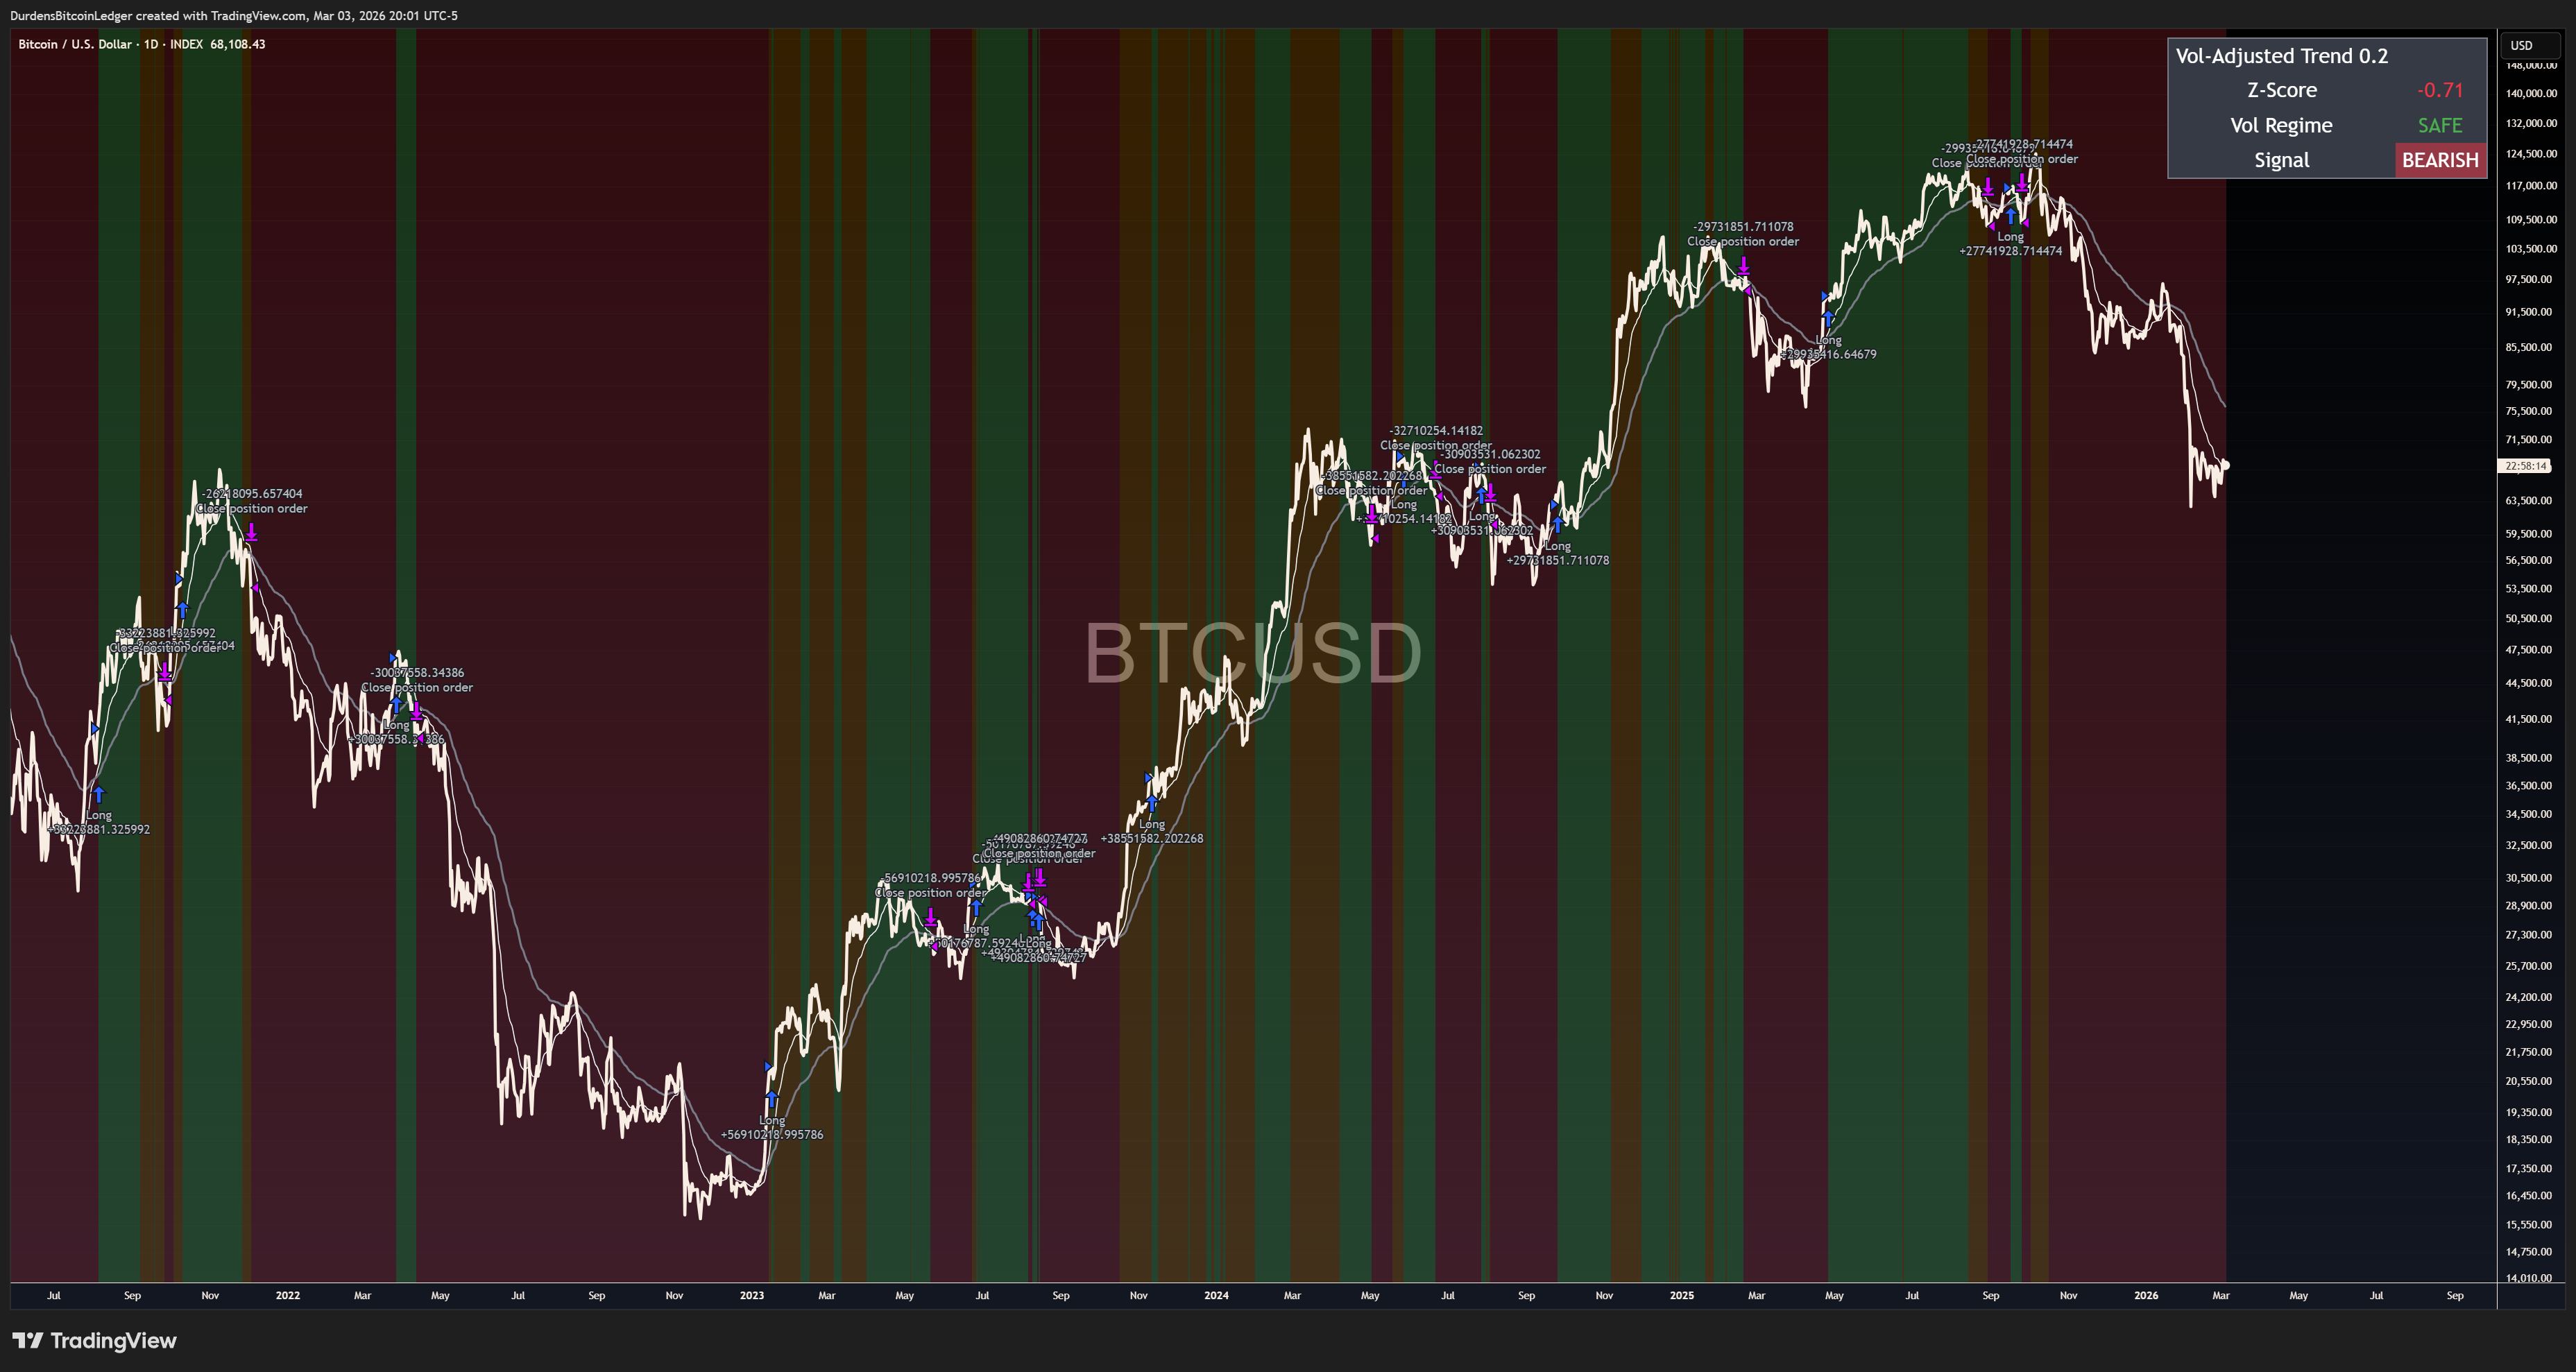
The Slow Signal: VATS (Vol-Adjusted Trend Signal)
VATS asks a completely different question than GVTS. While GVTS asks "has the trend flipped?", VATS asks: "Is this trend move statistically significant relative to the current volatility regime?"
priceFast = EMA(close, [15-25]).. ~1 month of price
priceSlow = EMA(close, [50-70]).. ~3 months of price
priceSpread = priceFast − priceSlow
volatility = StDev(close, [50-70]).. 3-month vol
Z-Score = priceSpread / volatility
This is a volatility-normalized momentum oscillator. Dividing by the [50-70]-period standard deviation converts the raw spread into z-score units.. a dimensionless number comparable across all price levels and volatility regimes. A z-score of 0.5 means the same thing whether BTC is at $3,000 or $100,000.
The 25%→100% Position Ramp (8th Rule Only)
The 25%→100% ramp is the architectural feature that distinguishes the 8th Rule from Arsenal BTC. It's only present in the 8th Rule.. Arsenal BTC uses three states (100/50/0%) instead.
FLAT (0%) —[GVTS Bull]→ 25% LONG —[VATS Z > 0.15]→ 100% LONG
Exit at 25%: GVTS bear only.
Exit at 100%: GVTS bear OR VATS drops below threshold.
When GVTS is right but VATS never confirms (~26% of entries): you lose on 25% of capital, not 100%. Max exposure to a whipsaw is quartered.
When both confirm (~74% of entries): you're at 100% within 1–5 days. You've lost almost no upside.. the big momentum comes after VATS confirms.
| GVTS | VATS Z-Score | Position | Action |
|---|---|---|---|
| Bearish | Any | 0% | Cash. No exceptions. Wait for GVTS to flip. |
| Bullish | < 0.15 | 25% | Starter position. Wait for VATS confirmation. |
| Bullish | > 0.15 | 100% | Full position. Both signals aligned. Ride the trend. |
Backtest — The 8th Rule (2014–2026)
The 8th Rule numbers below are unchanged since the product was frozen as a legacy offering. They reflect the system as currently shipped to subscribers.
| Metric | The 8th Rule (Spot) | BTC Buy & Hold |
|---|---|---|
| CAGR | ~65.5% | ~45% |
| Max Drawdown | −-42.3% | −84% |
| Sharpe Ratio | 1.54 | N/A |
| Profit Factor | 4.62 | N/A |
| Total Trades | 56 | 1 |
| Win Rate | 70% | N/A |
| Avg Loss | −7.57% | N/A |
| Period | 2014–2026 | 2014–2026 |
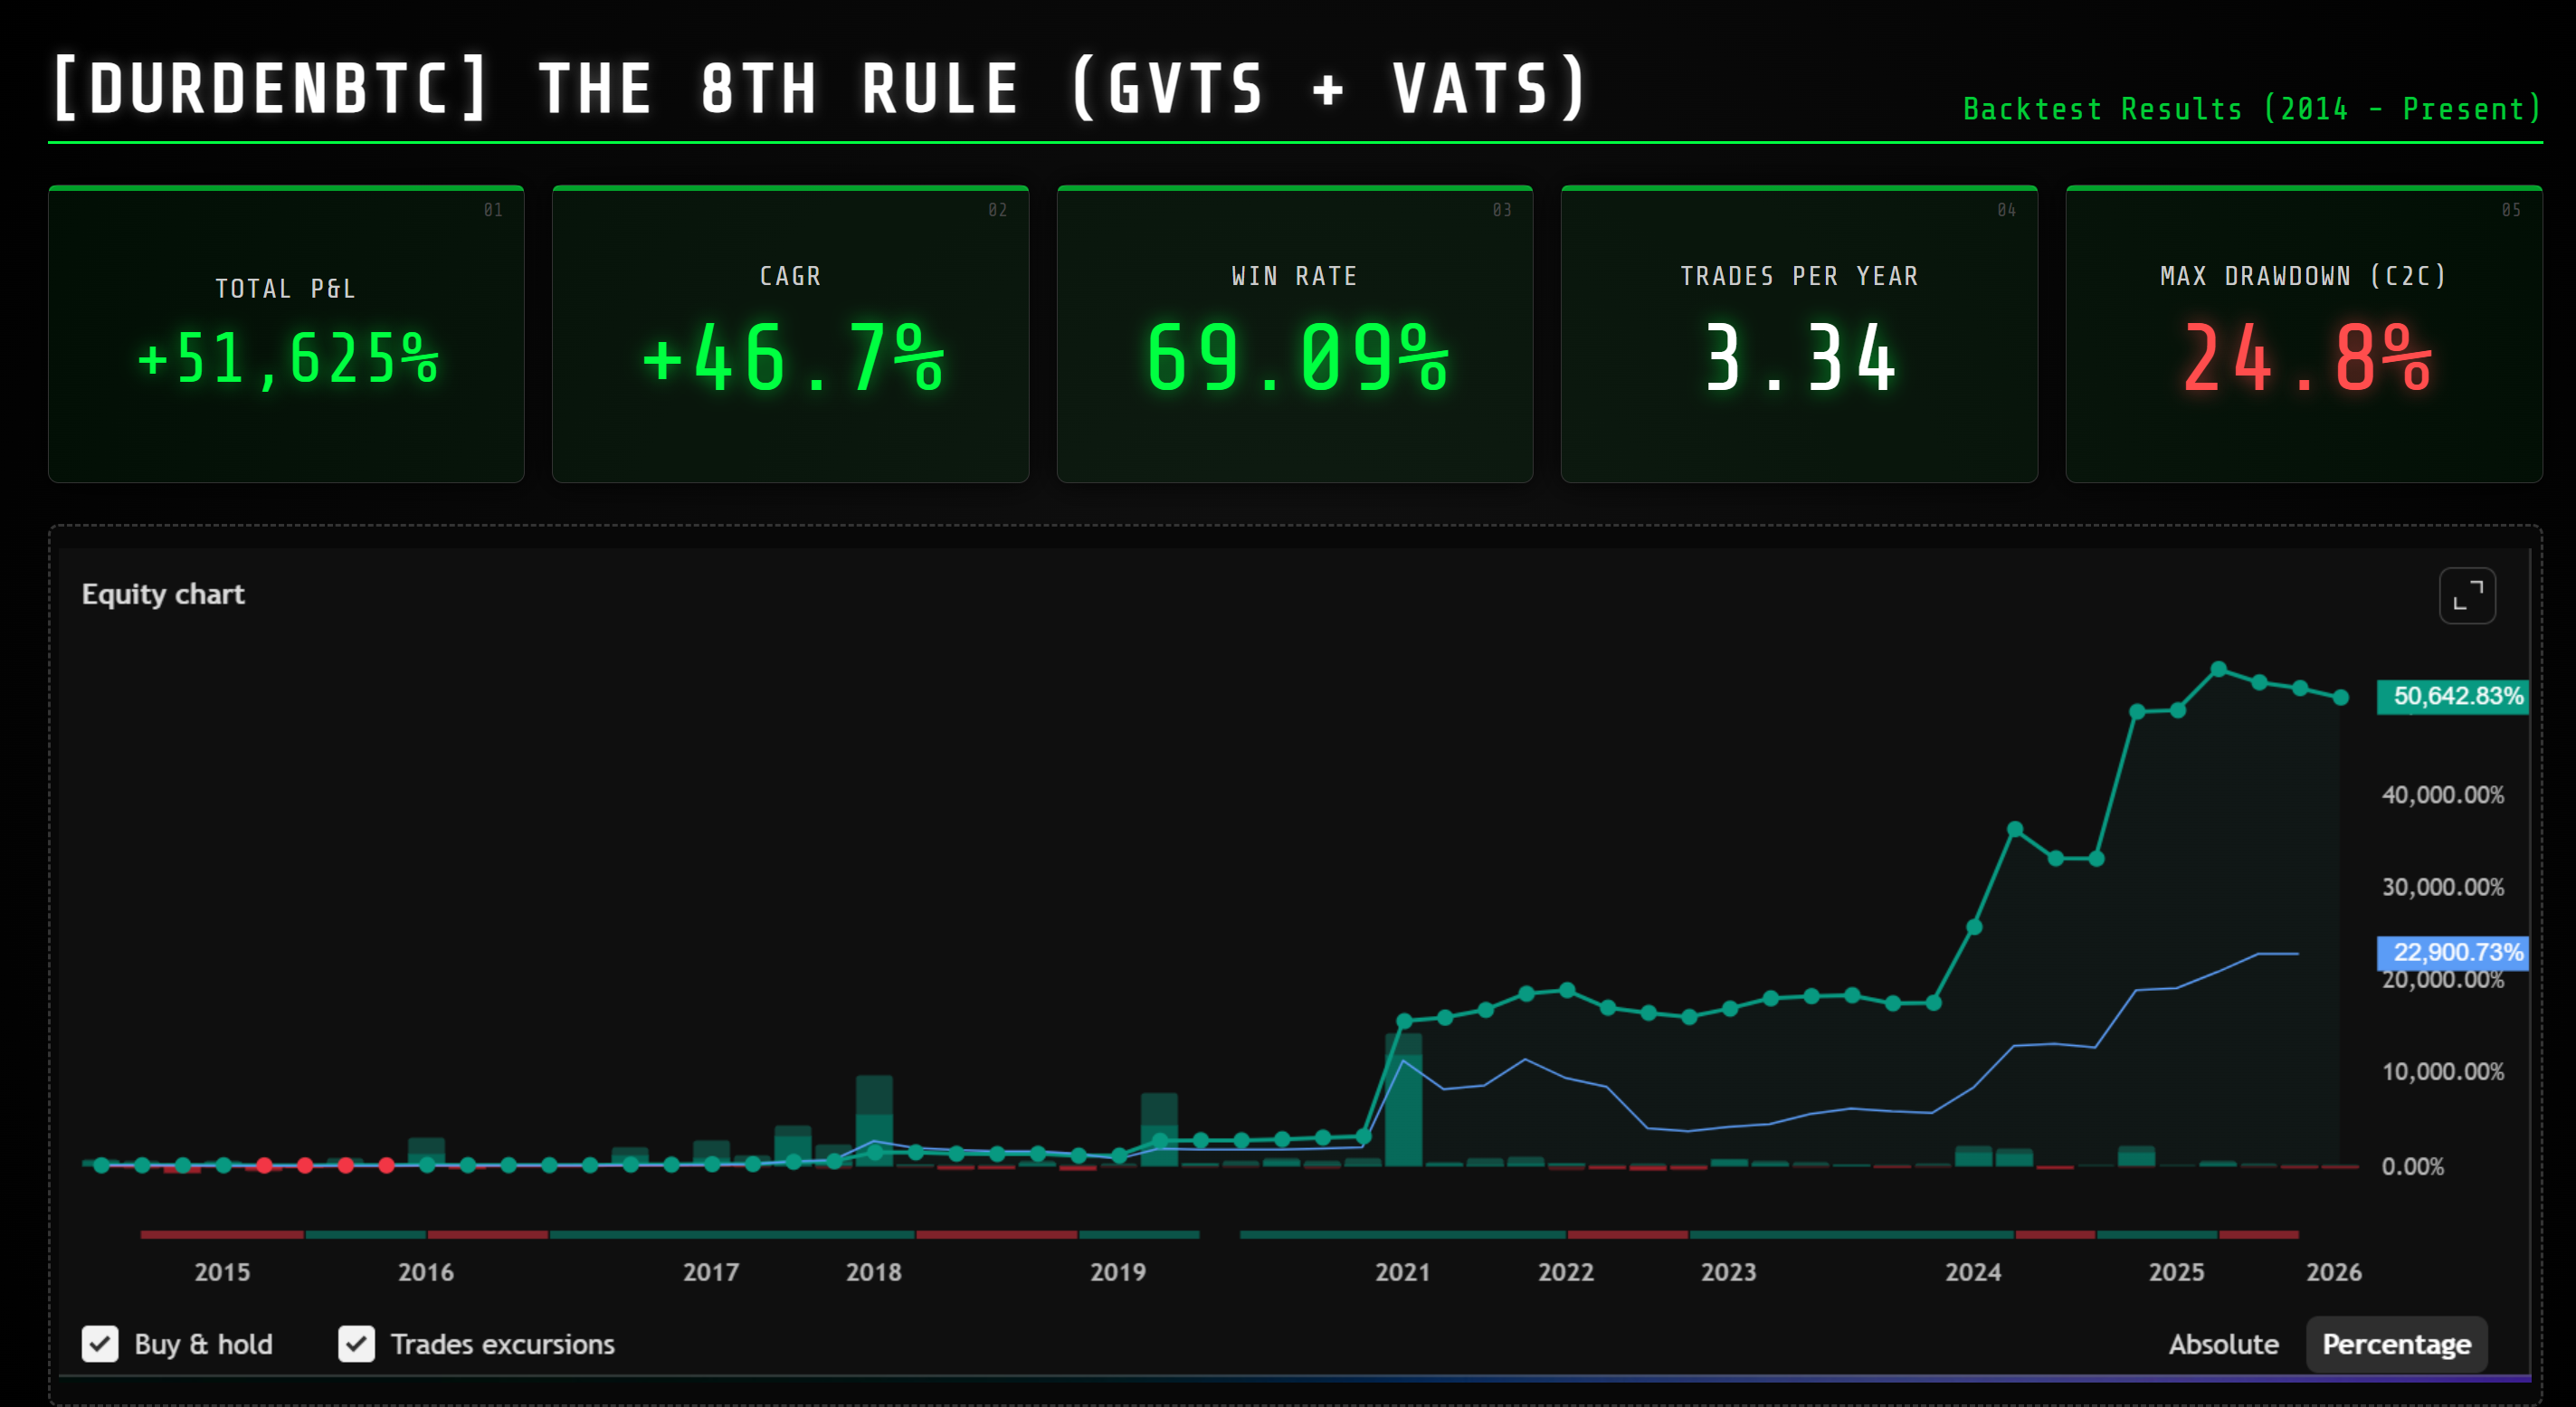
Buy-and-hold's −84% max drawdown required a +525% recovery just to break even. The 8th Rule's −24.1% close-to-close max drawdown required only ~32%. That difference in recovery time means the managed portfolio is compounding forward while buy-and-hold is still digging out of a crater. Over multiple cycles, this gap compounds permanently.
Spot Bitcoin, No Leverage
Both Arsenal BTC and The 8th Rule are designed for spot Bitcoin.. no leverage, no margin, no liquidation risk. This is not a limitation. It's a feature.
| Factor | Spot | 10× Leverage |
|---|---|---|
| Liquidation Risk | Zero | HIGH |
| BTC drops 10% | You're down 10% | Liquidated.. 100% loss |
| Worst Historical Loss | −34% (Arsenal) / −24% (8th Rule) | −100% (forced exit) |
| Monitoring Required | Daily close check | Constant |
| Deployability | Immediate | Caution |
With spot, a deep BTC drawdown means you're down the percentage but you still own the BTC. The system exits strategically before the worst of it. With leverage, a 10% adverse move and you're liquidated.. you own nothing. There's no system on Earth that can protect a leveraged position from a gap-down liquidation event. The compounding advantage of spot + systematic risk management is the entire pitch.
Which System Fits You?
Most subscribers run Arsenal BTC as the primary signal. The 8th Rule sits alongside as a more aggressive alternative for the subset of members who prefer higher turnover.
Layer in the macro regime context for conviction. Either Bitcoin signal firing during a Goldilocks regime with expanding global M2 is the highest-conviction setup in the framework. All three layers aligned. That's when you press.
Two Systems, One Discipline
"Different problems require different tools, but the disciplines are identical: daily-close execution, full backtest disclosure, and forward-test honesty.. including the WEAK results when they happen."
Arsenal BTC is the calmer flagship: VAMS architecture, three-state positioning, captured most of Bitcoin's upside while cutting drawdown by more than half (−34% vs −83%). The 8th Rule is the legacy aggressive alternative: GVTS + VATS, 25%→100% asymmetric ramp, 65.5% CAGR with a −24.1% close-to-close max drawdown across 56 trades.
For the full architecture and live signal state on each, see the Arsenal BTC page and The 8th Rule page. For forward-tested validation including the WEAK OOS verdict on Arsenal BTC, see the forward-testing page. For the broader portfolio framework, see the trend-following guide.
Live Charts
Free macro regime updates, strategy breakdowns & thesis posts.
Sources
Primary Data
Academic Foundations
Full academic bibliography — DurdenBTC Academic Foundations →