Why Liquidity Is Everything
Almost everything in markets boils down to three dominant forces: liquidity, growth, and inflation. Together, they define the regime you're actually trading. Not 30 indicators. Not 100 different moving averages. Not whatever financial astrology is trending on TikTok this week. Just three variables.
Of the three, liquidity is the most powerful. Growth can be slowing and inflation can be rising, but if the central bank is printing money fast enough, risk assets still go up. Liquidity is the tide that lifts all boats.. and when it recedes, it drowns everything in its path.
"The market's real engine is liquidity. Everything else is narrative."
Bitcoin is the purest liquidity play in public markets. It has no earnings, no cash flows, no dividends. Its price is almost entirely a function of how much capital is available to flow into risk assets. When the system is flush with cash, Bitcoin rallies.. often violently. When liquidity drains, Bitcoin falls.. often more violently. Understanding the liquidity cycle is the single most important skill for trading Bitcoin at the macro level.
The Fed Playbook
The Federal Reserve is the most powerful liquidity pump in the world. Its balance sheet, currently north of $7 trillion.. determines the base level of dollar liquidity in the global financial system.
Quantitative Easing (QE)
The Fed buys Treasury bonds and mortgage-backed securities from banks. Banks get cash reserves in return. Those reserves flood through the banking system, lowering rates, compressing spreads, and pushing capital up the risk curve. QE in 2020 added $4.8 trillion to the Fed's balance sheet. Bitcoin went from ~$7,000 to ~$69,000.
Quantitative Tightening (QT)
The reverse. The Fed lets bonds mature without replacing them, draining reserves from the system. Less liquidity means higher rates, wider spreads, and capital retreating from risk. QT in 2022 coincided with Bitcoin falling from $69,000 to $15,500.
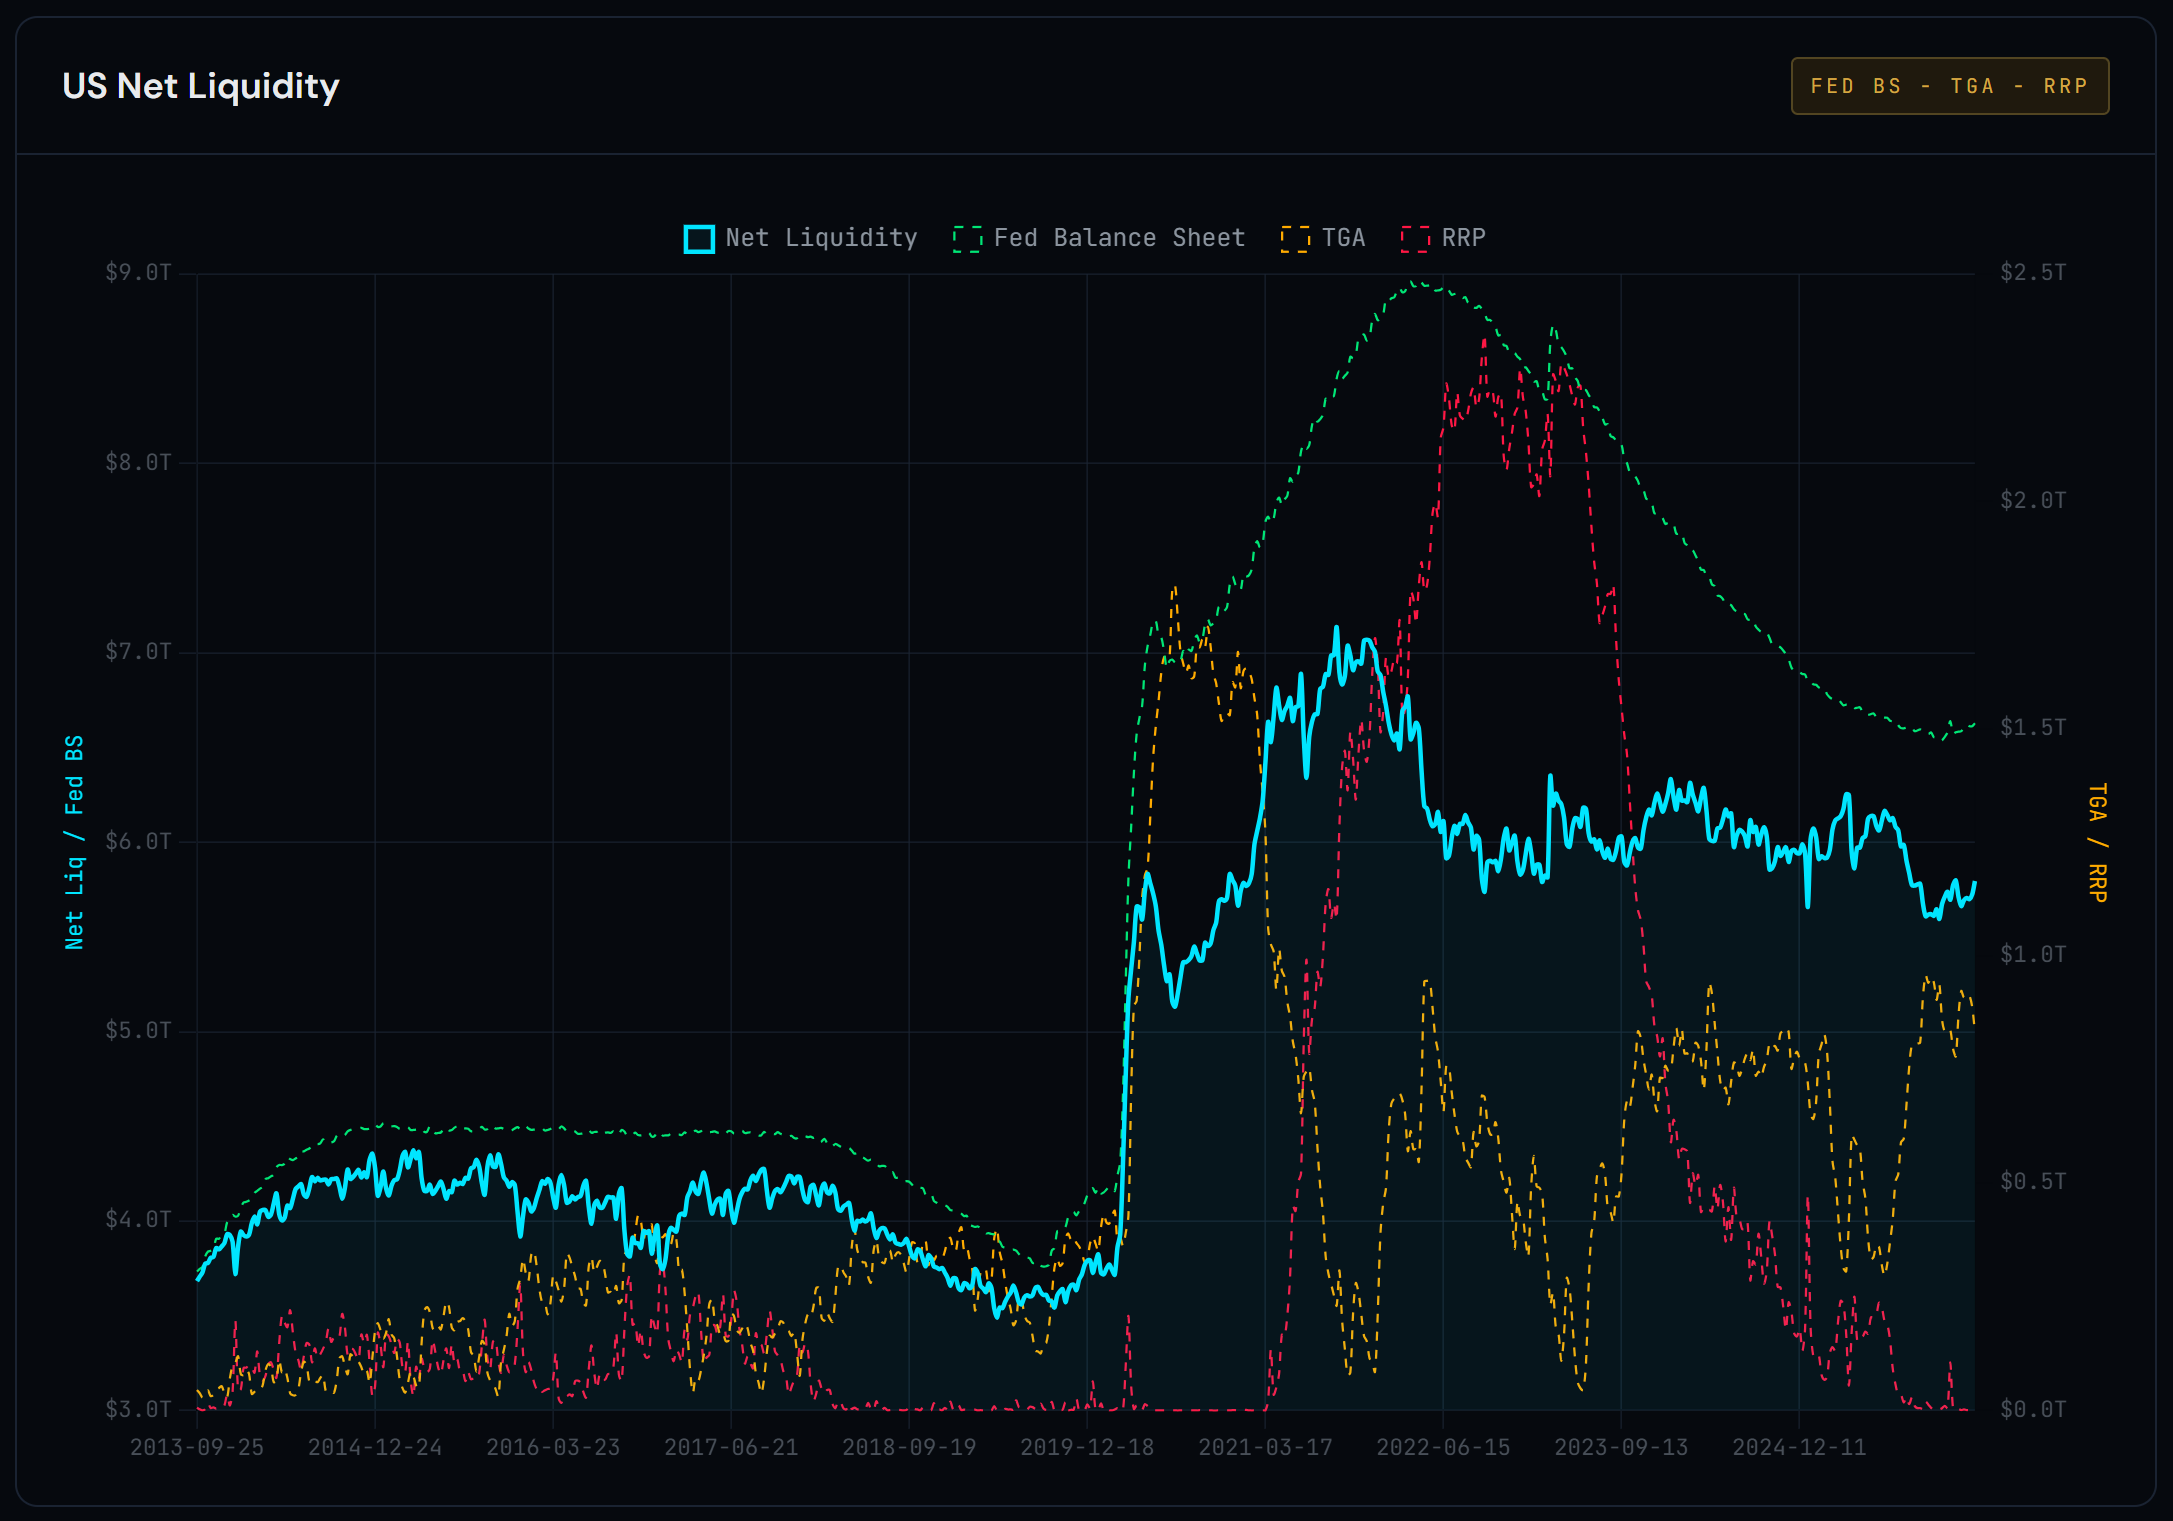
Net Liquidity = Fed Balance Sheet − TGA − RRP
The TGA (Treasury General Account) is the government's checking account. When the Treasury builds its balance, that cash is parked at the Fed.. removing liquidity from the system. When the Treasury spends, it releases liquidity.
The RRP (Reverse Repo) is where money market funds park excess cash overnight at the Fed. High RRP means cash is sitting idle, not flowing into risk assets. Falling RRP means that cash is being redeployed.. into bonds, equities, and eventually Bitcoin.
| Regime | Fed BS | TGA | RRP | Net Liquidity | Bitcoin Signal |
|---|---|---|---|---|---|
| QE | ↑ Expanding | ↓ Falling | ↓ Falling | ↑ Rising | Bullish |
| QT | ↓ Shrinking | ↑ Rising | ↑ Rising | ↓ Falling | Bearish |
| Hold | Flat | Varies | ↓ Falling | Mildly ↑ | Cautious Bull |
The third row is crucial and often missed. Even when the Fed isn't actively expanding its balance sheet, falling RRP alone can inject hundreds of billions in effective liquidity. This is exactly what happened in 2023: the Fed was technically still in QT, but RRP drained from $2.3T to under $500B, releasing ~$1.8T into the system. Bitcoin rallied from $16K to $73K. The headline said "tightening." The plumbing said "easing."
The Broader Liquidity Picture
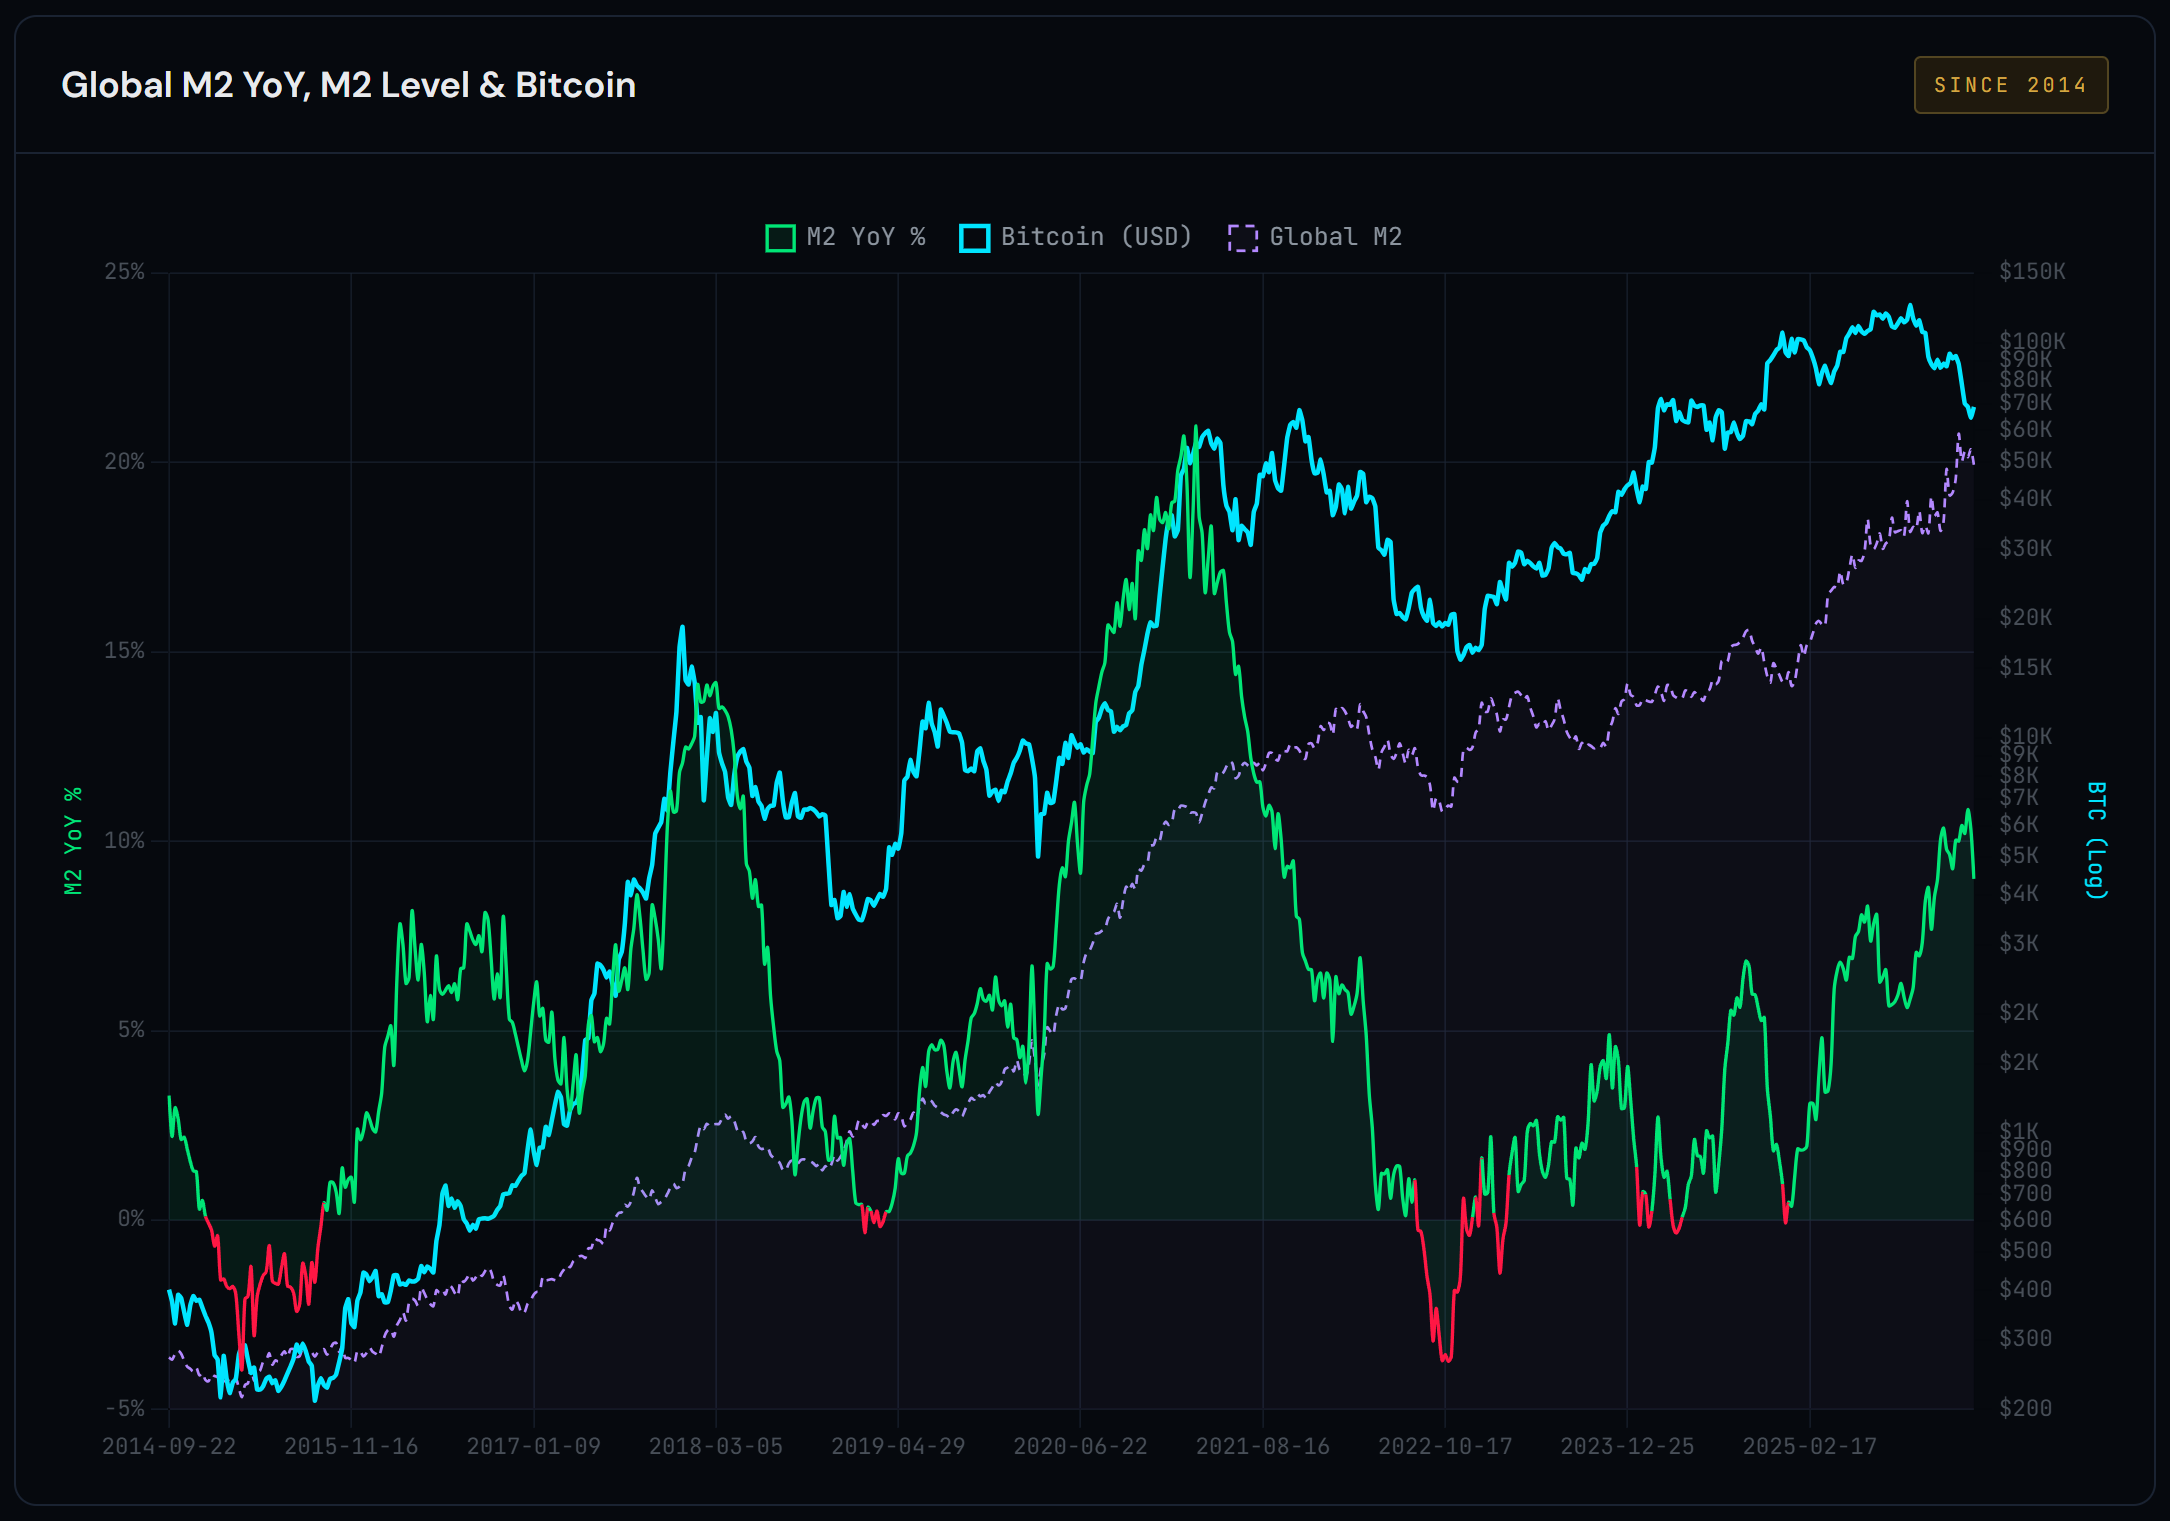
The Fed is the biggest player, but it's not the only one. Global M2.. the aggregate money supply from 20+ countries, FX-adjusted to USD.. captures the total liquidity available to flow into risk assets.
The lag between global M2 changes and Bitcoin's price response is 84–107 days. This lag exists because monetary policy transmission takes time. Central banks expand M2 → reserves increase → bond markets absorb it → equities rally → high-beta assets (Bitcoin) catch the spillover. By tracking M2 with the offset applied, you can see the liquidity wave approaching before it hits.
The three heavyweights: the US Fed (~28% of global M2), China's PBOC (~32%), and the European ECB (~18%). China often leads.. the PBOC tends to ease ahead of the Fed because China's economic cycle is 6–12 months ahead. When Chinese M2 starts expanding, it's a leading indicator for global risk appetite. Track the regional 90-day deltas to see who's pulling the lever.
The DurdenBTC Global M2 Liquidity Tracker on TradingView applies the offset, EMA-89 regime filter, and Fibonacci SMAs automatically. For the full breakdown of how to use it, read the Global M2 guide.
Fiscal Dominance
This is the long-term thesis that underpins everything. And it's the most bullish macro case for Bitcoin that exists.
The problem: The US government is issuing more debt than the private market wants to buy. Treasury supply is exceeding demand. Foreign buyers (Japan, China) are stepping back. Domestic buyers are demanding higher yields. The deficit is structural.. not cyclical.. and projected to widen.
The endgame: The Fed loses independence and becomes the financier of the US government. Not by choice.. by necessity. When Treasury auctions start failing, the Fed will be forced to step in as the buyer of last resort. This is yield curve control. It's projected by multiple serious macro analysts to arrive around 2028–2029.
Yield curve control means permanent monetary expansion. The Fed will be printing to fund government spending indefinitely. This is the ultimate liquidity injection.. not cyclical QE that gets reversed, but structural monetization of sovereign debt. In this world, hard assets (Gold, Bitcoin) reprice dramatically higher because the denominator (dollars) is being actively debased.
In the short run, the path is volatile. Fiscal dominance means higher deficits, more Treasury issuance, periodic market shocks when auctions disappoint, and political pressure on the Fed. But the destination.. permanent money creation.. is the most bullish possible environment for Bitcoin. Understanding this trajectory is why the macro regime framework includes credit stress indicators and business cycle signals alongside pure liquidity measures.
Building Your Liquidity Dashboard
Five metrics. That's all you need.
| Metric | What It Tells You | Where to Find It |
|---|---|---|
| Fed Balance Sheet | Base level of dollar liquidity | FRED (weekly) |
| TGA Balance | Government spending/hoarding | US Treasury Daily Statement |
| RRP Balance | Idle cash returning to system | NY Fed (daily) |
| Global M2 (FX-adjusted) | Total world liquidity available | DurdenBTC TradingView indicator |
| 10Y Breakeven | Market inflation expectations | FRED / TradingView |
Net Liquidity = Fed BS − TGA − RRP. Track this weekly. When it's rising, Bitcoin has a tailwind. When it's falling, Bitcoin has a headwind. Layer in the global M2 with its 84–107 day offset for the forward-looking signal. Add the 10Y breakeven for inflation context.. rising breakevens during an expansion suggest Reflation (risk-on), while rising breakevens during contraction suggest Inflation (risk-off).
This dashboard feeds directly into the macro regime classification. The regime engine automates the synthesis, but understanding each component gives you the conviction to trust the output. The weekly research updates on Substack provide current readings on all five metrics.
Follow the Flow
"Every macro rally needs liquidity. Every crash is preceded by liquidity drying up."
Bitcoin is the highest-beta liquid risk asset in existence. Its price is a function of global liquidity flow. Track the Fed balance sheet, net liquidity, and global M2. Understand the lag. Respect the fiscal dominance trajectory. And always, always combine liquidity context with the entry signals and risk management framework before deploying capital.
Liquidity tells you which way the current is flowing. The regime engine tells you which quadrant you're in. The signal system tells you when to enter. Together, they form a complete framework. Use it.