The Concept Behind Trend Conviction
Every trader knows that trends don't exist in a vacuum. A 2% Bitcoin move during calm, low-volatility conditions is significant. That same 2% move during a vol spike is noise. Most traders ignore this distinction. That's why they get shaken out.
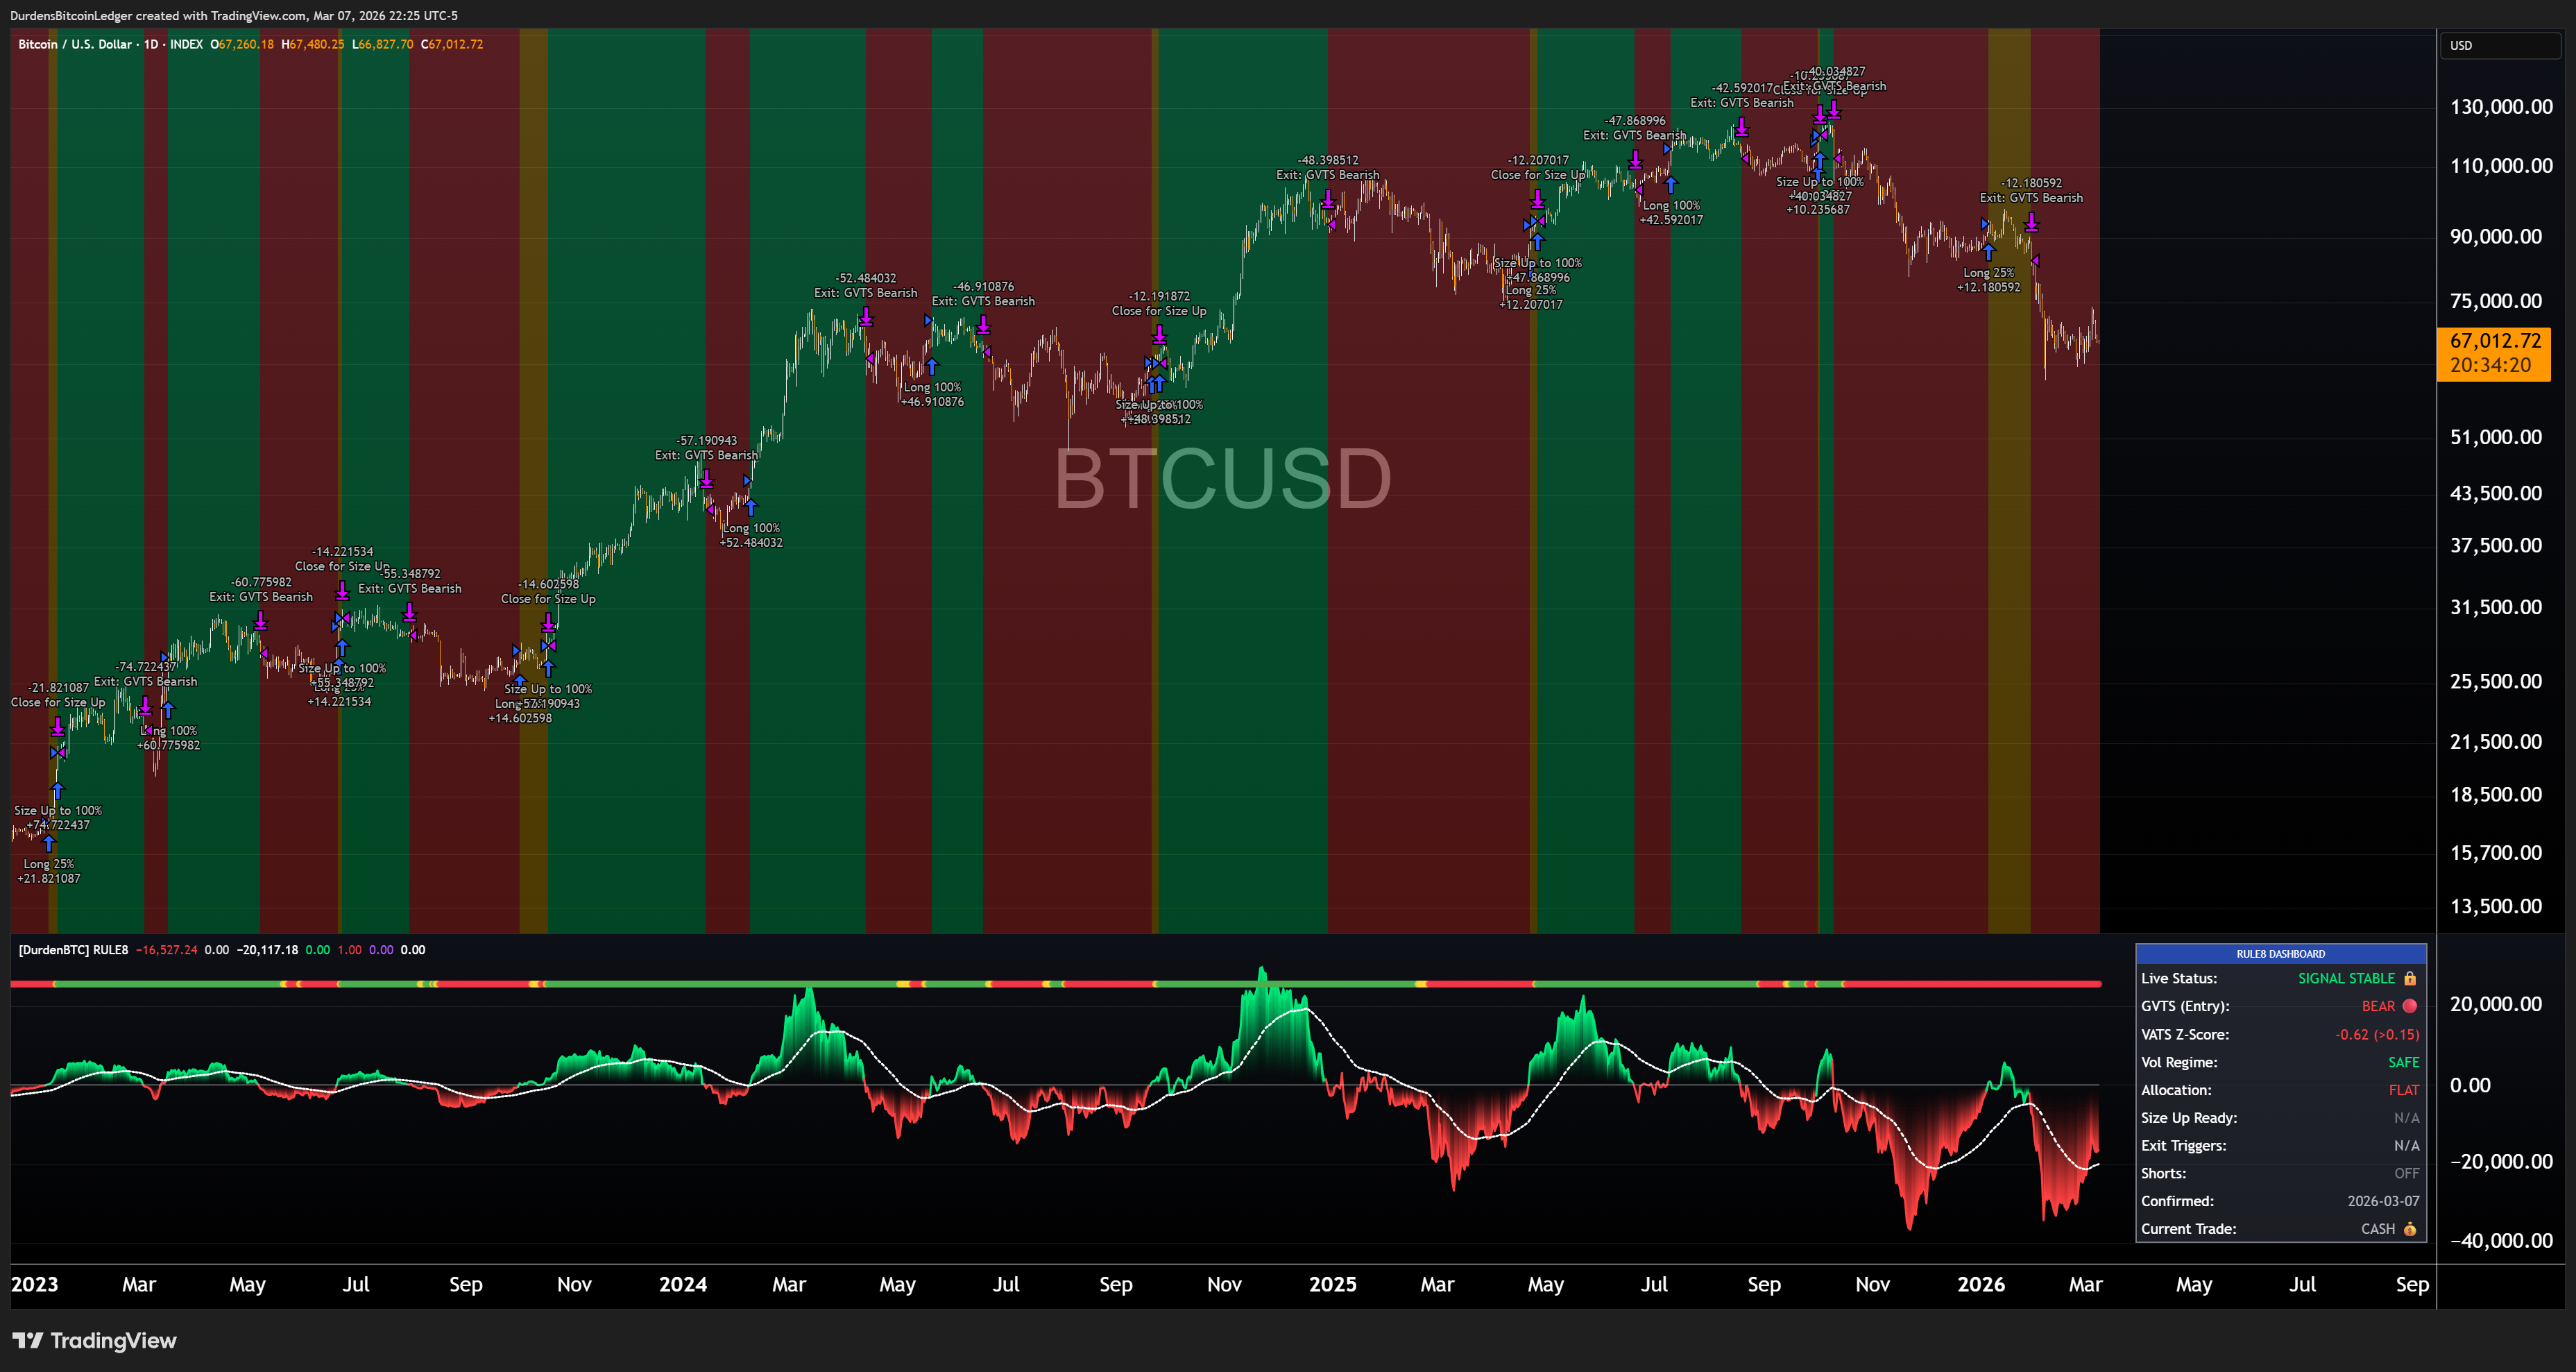
VATS answers the question: "How strong is this trend, adjusted for how noisy the market is right now?" It's the volatility-normalized z-score that sits at the heart of The 8th Rule system, acting as the confirmation layer that turns a 25% position into a 100% position.
Where the Macro Regime Engine operates across 20+ assets to measure macro regime conviction, VATS operates on Bitcoin alone, measuring trend strength using EMA spreads and realized volatility. The principle is identical: normalize momentum by dividing it by volatility to get a true apples-to-apples measure of conviction. A VATS z-score of +0.3 tells you exactly how many standard deviations of trend strength you're seeing.. no ambiguity about whether you're in a trending market or just seeing noise.
VATS asks: "Is this uptrend real, or is it just volatility expansion?" When VATS is high, you have both momentum AND it's happening in a clean market. When VATS is low, either the momentum isn't there OR the market is so chaotic that the signal can't be trusted.
The Z-Score Formula
fast = EMA(close, [15-25]).. 1-month exponential moving average
slow = EMA(close, [55-65]).. 3-month exponential moving average
momentum = fast − slow.. the spread
vol = StDev(close, [55-65]).. realized volatility over [55-65] bars
VATS = momentum / vol.. the z-score
Why EMA Spreads Instead of Log Returns
While the Macro Regime Engine's scoring algorithm uses cumulative log returns, VATS uses EMA spreads. Why? Speed and clarity. An EMA-[15-25] minus EMA-[55-65] spread captures the distance between short-term and long-term trend paths. When the fast EMA is far above the slow EMA, it's a trending market. When they're close, it's choppy. This is immediate and intuitive.. you can see it on a chart. The spread itself is already a momentum measure; dividing by volatility just normalizes it.
Why Divide by Volatility
A 500-point EMA spread on Bitcoin means nothing without context. Is Bitcoin in a calm market (vol = 2%)? Then that spread is enormous. Is Bitcoin in a crisis (vol = 8%)? Then that spread is puny. By dividing the spread by the [55-65]-bar standard deviation, VATS converts the spread into standard deviation units.. a universal measure of how far from the mean you've moved.
This is identical to a Sharpe ratio calculation: excess return divided by volatility. VATS does the same thing for Bitcoin's momentum, producing a dimensionless score that's comparable across all volatility regimes. A VATS of +0.25 always means the same thing, whether we're in the calm of 2023 or the chaos of 2024.
BULLISH, NEUTRAL, BEARISH
VATS classifies Bitcoin's trend into three distinct states, but with a twist: the volatility regime overlay. A positive z-score doesn't automatically equal BULLISH if volatility is spiking dangerously.
| State | Condition | Z-Score Threshold | Meaning |
|---|---|---|---|
| BULLISH | z > 0.15 + vol regime safe | > +0.15 | Momentum positive AND volatility is calm. Safe to size up. |
| NEUTRAL | z > 0.15 + vol regime dangerous | > +0.15 | Momentum positive but volatility is spiking. Hold but don't expand. |
| BEARISH | z < 0.15 | < +0.15 | Momentum is weak or negative. Reduce or exit. |
The 0.15 threshold is precise by design. It reflects Bitcoin's specific volatility profile and has been validated across backtests where the system achieved a ~65.5% CAGR with 70% win rate over 56 trades.
This is the subtle but critical piece: even if VATS z-score is positive, the system checks whether annualized volatility is above its EMA. If it is, we're in a dangerous volatility regime and VATS returns NEUTRAL. We keep the position but don't scale. This logic gate has saved countless drawdowns by refusing entries when conviction is high but the market is too chaotic.
How VATS Works as Confirmation
The 8th Rule operates in two stages: initiation (GVTS) and confirmation (VATS). Understanding this two-layer approach is critical.
The GVTS Entry (25% Position)
GVTS (DurdenBTC's proprietary Gamma Volatility Trigger Signal.. parameters are confidential) fires first. It detects the earliest signs of a cycle shift. When GVTS triggers, the system enters with a 25% position. This is the foot in the door, but it's not the full conviction bet. Why? Because GVTS is fast but sometimes premature.
The VATS Confirmation (Scale to 100%)
Once GVTS has initiated, the system waits for VATS to confirm. VATS is slower (it uses longer-period EMAs) but more reliable. When VATS z-score exceeds 0.15 AND the volatility regime is safe, VATS signals confirmation. At that point, the system scales from 25% to 100%.
"GVTS fires. VATS confirms. Sizing follows."
Why This Sizing Works
This two-step approach accomplishes two things at once: it catches cycles early (via GVTS) without overcommitting, then increases exposure only after VATS confirms that momentum is genuinely building. The backtest results speak for themselves: ~65.5% CAGR, 4.62 profit factor, 70% win rate.
| Stage | Signal | Position Size | Purpose |
|---|---|---|---|
| Initiation | GVTS | 25% | Early entry, test the move |
| Confirmation | VATS | Scale to 100% | Increase conviction, full position |
| Exit | Either goes invalid | Wind down | Reduce or close as conviction dies |
The Logic Gate
The volatility regime overlay in VATS is perhaps the most underappreciated piece of the system. It's been the difference between winners and drawdown disasters in live trading.
How It Works
At every VATS check, the system calculates annualized volatility and compares it to a longer-period EMA of volatility. If current vol is above that EMA, we're in a dangerous regime. If below, we're safe.
A positive VATS z-score + safe vol regime = BULLISH signal (enter or scale)
A positive VATS z-score + dangerous vol regime = NEUTRAL signal (hold but don't scale)
A negative VATS z-score = BEARISH signal (exit)
Why This Filter Matters
Volatility and momentum can deceive you together. During the 2022 crash into the FTX implosion, Bitcoin had positive momentum (it was bouncing) but volatility was completely out of control. A trader using just a raw z-score would have scaled in. A trader using VATS with the volatility overlay would have stayed flat. The volatility overlay kept you alive when it mattered most.
December 2022: Bitcoin VATS z-score ticks above 0.15. Classic BULLISH by raw z-score alone. But annualized vol is 85% (above its EMA of 40%). VATS overlay: NEUTRAL. You hold your 25% but don't scale to 100%. Three days later, the FTX fallout hits and volatility explodes to 120%. Your smaller position survives. The trader who scaled in on raw z-score is nursing a drawdown. This is the game-changing feature.
Where to Find VATS & How to Use It
VATS is live and public on TradingView. You can grab it directly from the source.
DurdenBTC's Vol-Adjusted Trend Signal v0.2.. Open source, fully parameterized. Watch the z-score cross 0.15. Watch the vol regime layer. Use it to time entries and scale-ups in your Bitcoin trading.
How to Use It in Practice
1. If you're in The 8th Rule: VATS is already baked in. You're watching for the z-score to cross 0.15 and the vol regime to go safe. When both happen after a GVTS entry, you scale. You don't need to do anything manually; the system is designed to use VATS automatically.
2. If you're building your own system: VATS is a universal confirmation filter. Add it to any trend-following strategy. Use it to:
- Filter entries.. only enter when VATS z-score is positive
- Size entries.. increase size as VATS gets stronger (z > 0.25 = max size)
- Time exits.. when VATS drops below 0.15, reduce exposure
- Avoid false breakouts.. ignore VATS spikes when the vol overlay is red
3. If you're a trend follower: VATS z-score is your trend strength meter. Treat it like a volatility-adjusted RSI: the higher it is, the stronger the trend. The lower it is, the closer you are to a reversal. Use it to know when to add to winners and when to tighten stops.
Key Backtest Numbers
The system was tested across Bitcoin's full history with these results:
| Metric | Value | Context |
|---|---|---|
| CAGR | ~65.5% | Annualized return over full test period |
| Max Drawdown | −24.1% (close-to-close) | Largest loss from peak.. reasonable for crypto |
| Profit Factor | 4.62 | Every $1 risked made $4.62.. exceptional |
| Win Rate | 70% | Majority of trades profitable |
| Total Trades | 56 | Reasonable sample size over multi-year test |
Next Steps
Ready to use VATS? Start with The 8th Rule guide if you want a complete system. Or learn how VATS fits into the broader trend-following framework and Bitcoin signals hierarchy. For macro context, see how the Macro Regime Engine operates across 20+ assets to define the environment VATS operates in. And if you're managing drawdowns, check how position sizing and vol filters work together to keep you alive during chaos.
"Volatility-normalized momentum is the truth. Everything else is noise waiting to be filtered."