A month ago I hit a wall trying to reverse-engineer an institutional macro firm’s volatility-adjusted momentum signal. I was at 87% match.. stuck on Bloomberg-specific volatility data I couldn’t access without a $25,000/year terminal. Instead of grinding on that last 13%, I asked a different question: what if I just built something myself?
This is the story of building VATS-X.. a vol-targeted trend following engine that combines institutional-grade position sizing with my existing Macro Regime Engine.
The Problem With Binary Signals
Most trend following systems output a binary signal. Bullish. Bearish. Maybe neutral. You’re either in or you’re out.
Every institutional trend follower on the planet.. AQR, Man Group, Winton, Bridgewater, uses continuous signals. They don’t flip a switch.. they dial a knob. The difference in risk-adjusted returns is meaningful because a binary signal treats a raging bull market the same as a tentative recovery.
They’re not the same trade.
The academic foundation for this is rock solid. Moskowitz, Ooi & Pedersen’s 2012 paper “Time Series Momentum”1 demonstrated that momentum signals at multiple timeframes are partially decorrelated.. meaning combining them produces a higher Sharpe ratio than any single horizon.
And Moreira & Muir (2017)2 proved that simply scaling your position inversely with recent volatility improves the risk-adjusted returns of every major factor portfolio they tested.
I wanted to combine both ideas into a single engine. And I wanted it to work with my existing systems.
The Architecture: Three Layers Deep
VATS-X is built on three layers, each grounded in specific academic research:
Layer 1: Multi-Horizon Trend Composite (TSMOM)
Instead of a single moving average crossover, the engine computes momentum z-scores at four horizons simultaneously: 21-day, 63-day, 126-day, and 252-day. Each horizon captures a different market dynamic.
The 21-day catches V-bottoms and sharp reversals. The 63-day and 126-day capture the equity momentum sweet spot (Jegadeesh & Titman showed momentum peaks at 3-12 month horizons3). The 252-day provides the secular trend anchor.
The key innovation: adaptive weighting. During confirmed uptrends, the engine overweights the 63-day and 126-day horizons (where SPX momentum is strongest). During downtrends, it automatically shifts to inverse-variance weighting.. which mathematically upweights whichever signal is most stable.
In bear markets, the 252-day signal is deeply negative and very stable, so it gets high weight and pulls the composite down fast. This gives us aggressive entry during bulls and rapid exit during bears.
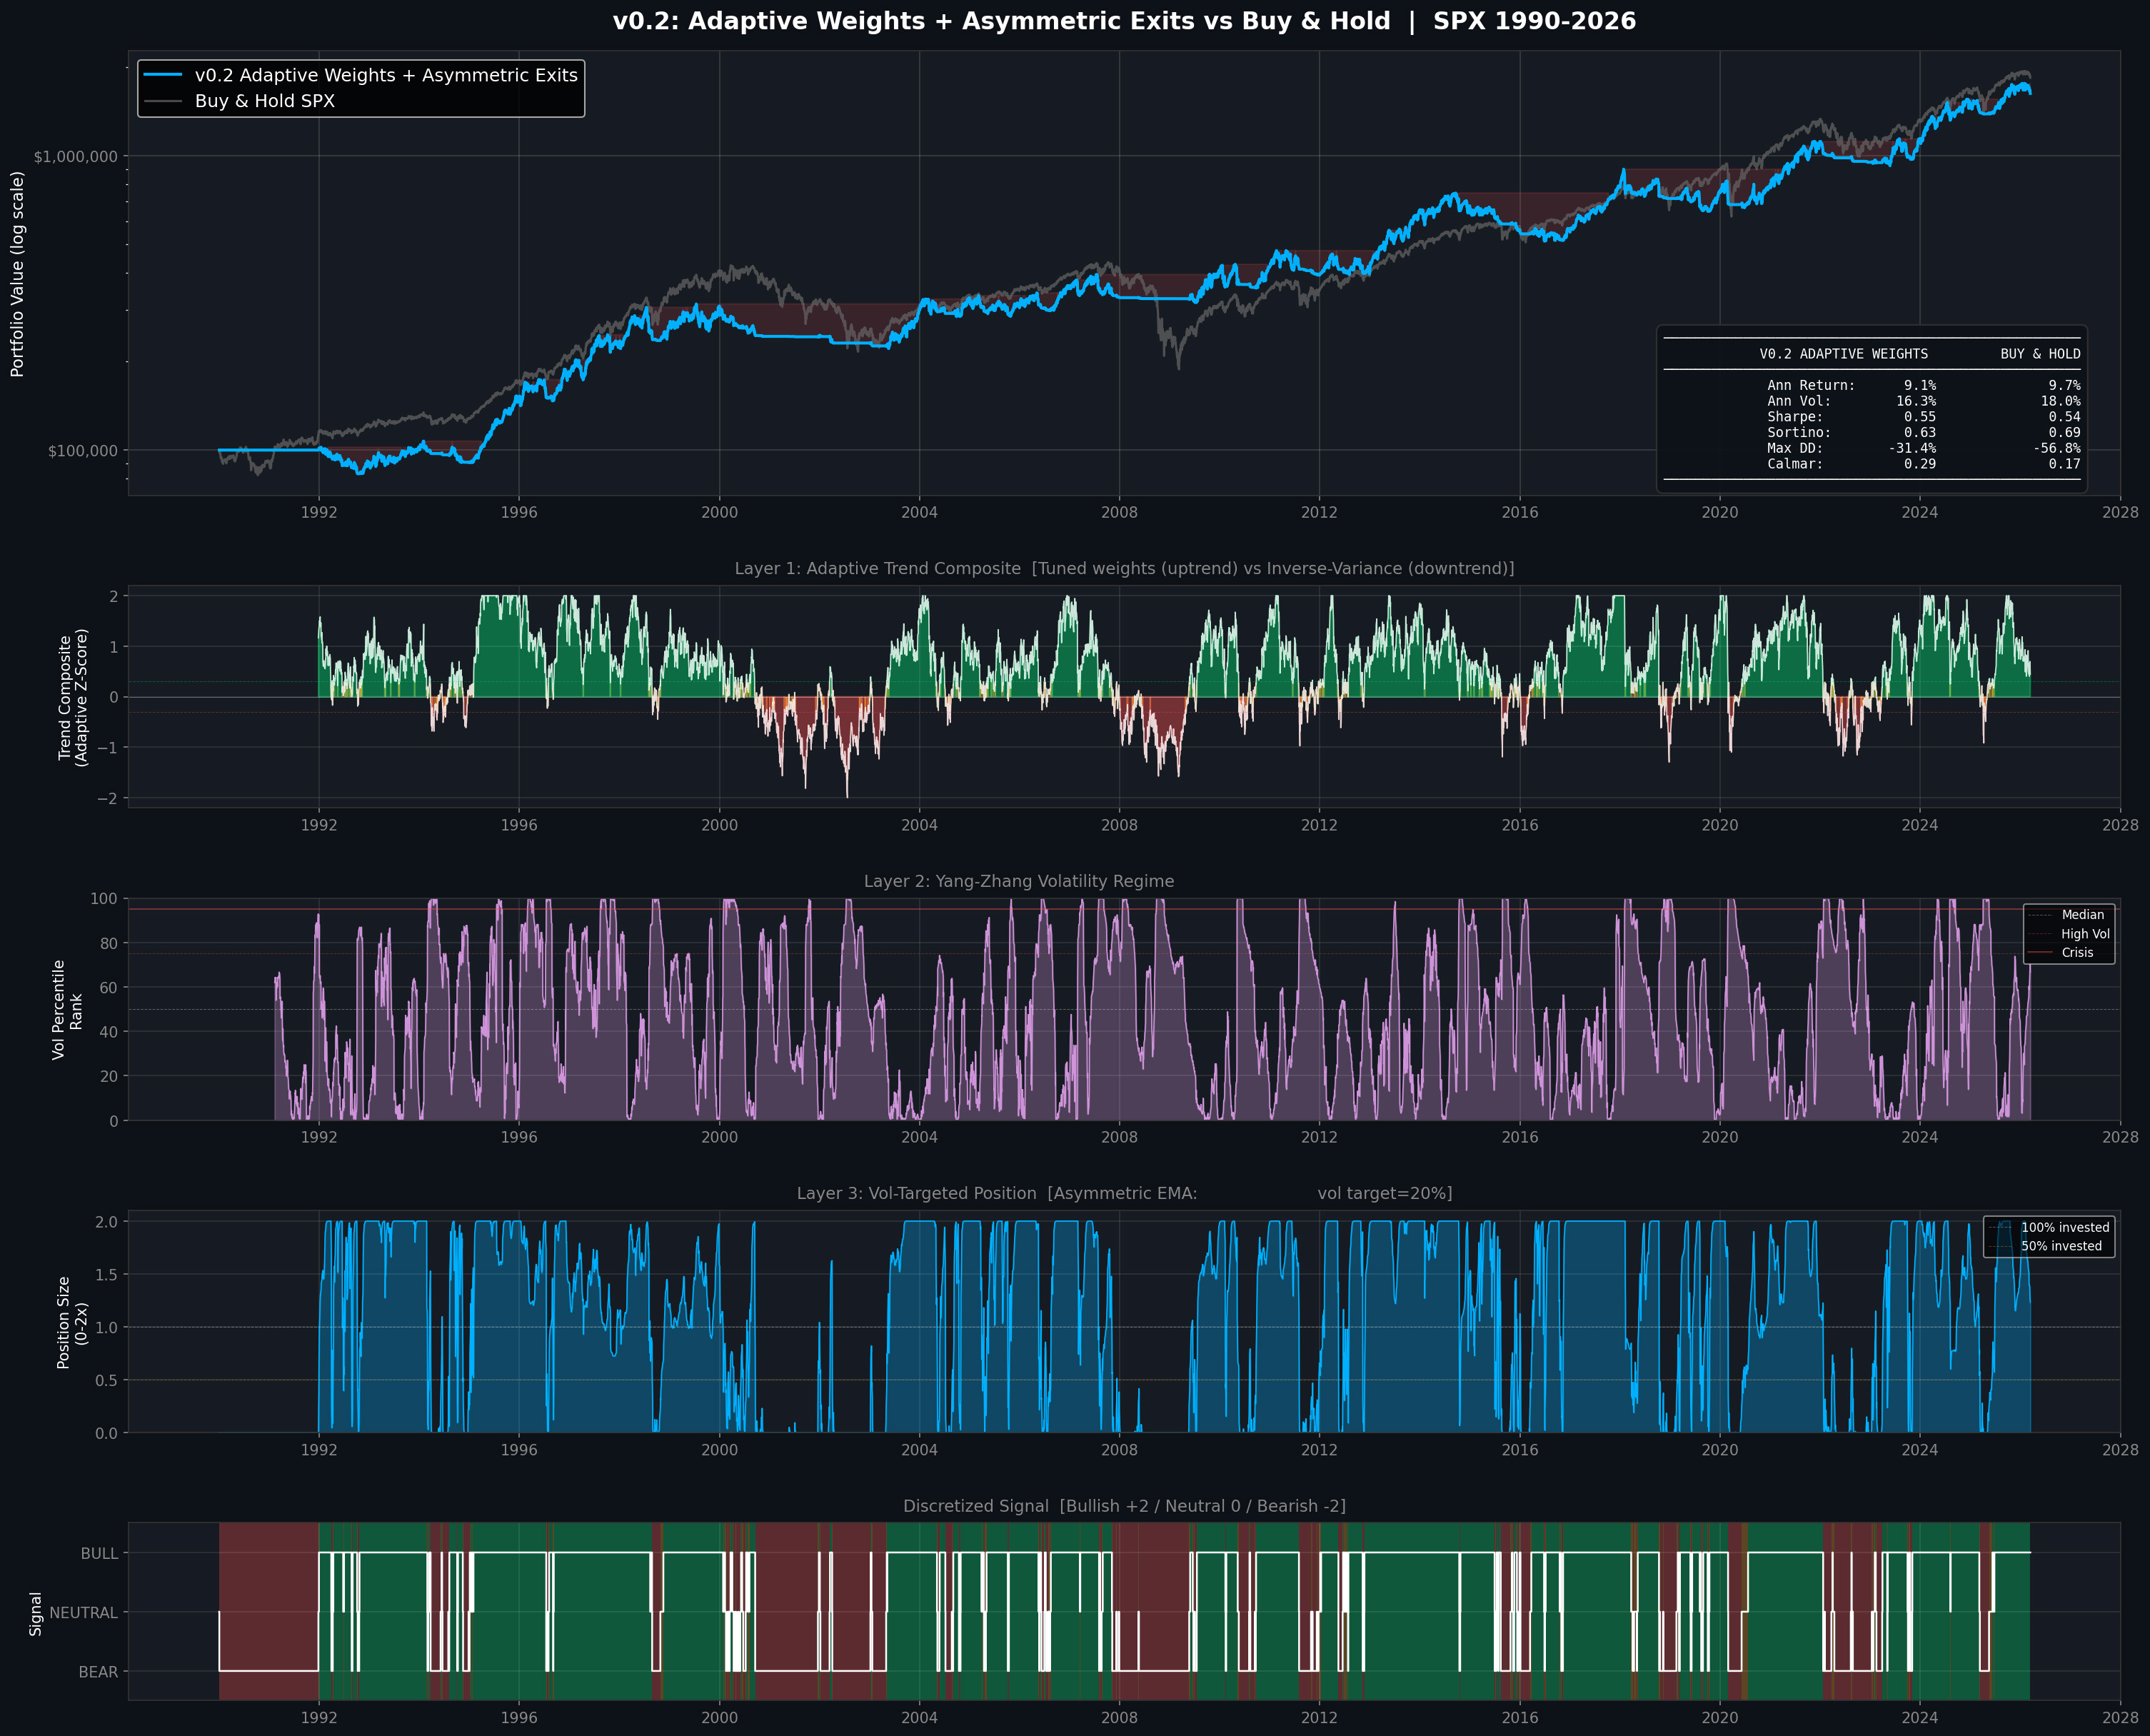
Layer 2: Yang-Zhang Volatility Regime
Not all volatility is created equal. The engine uses the Yang-Zhang (2000)4 estimator.. the most efficient OHLC-based volatility measure known.. to classify the current vol environment on a continuous scale.
Low vol environments get a boost to position size. High vol environments get dampened. Crisis-level vol triggers aggressive de-risking.
This is the Moreira-Muir framework in action. The vol targeting isn’t a separate overlay.. it’s baked into the position sizing math. Target a fixed annualized volatility, scale inversely with realized vol, and you automatically lever up in calm markets and de-lever in chaos.
Layer 3: Asymmetric Smoothing
This one came from studying how institutional CTAs actually manage positions. They pyramid into positions gradually (reducing entry noise) but exit rapidly (preserving capital). The engine uses a slow EMA when ramping up positions and a fast EMA when cutting. This asymmetry alone shaved several percentage points off drawdowns in every crisis that was tested.
The Hard Gate: Where It Gets Interesting
VATS-X on its own produced solid results on SPX going back to 1990. Not bad for a general-purpose engine with zero asset-specific tuning.
But the real breakthrough came when I combined it with my Macro Regime Engine.
The MRE polls 20+ global assets across equities, currencies, bonds, commodities, credit, and volatility to determine the macro regime. It flips roughly once or twice per year between risk-on and risk-off. On its own, it produces phenomenal risk-adjusted performance from a binary signal.
The combination is simple and elegant: when MRE says risk-off, position goes to zero. No exceptions. When MRE says risk-on, VATS-X controls the sizing. I call it the Hard Gate.
The MRE provides the timing. VATS-X provides the sizing. Each system solves a different problem.
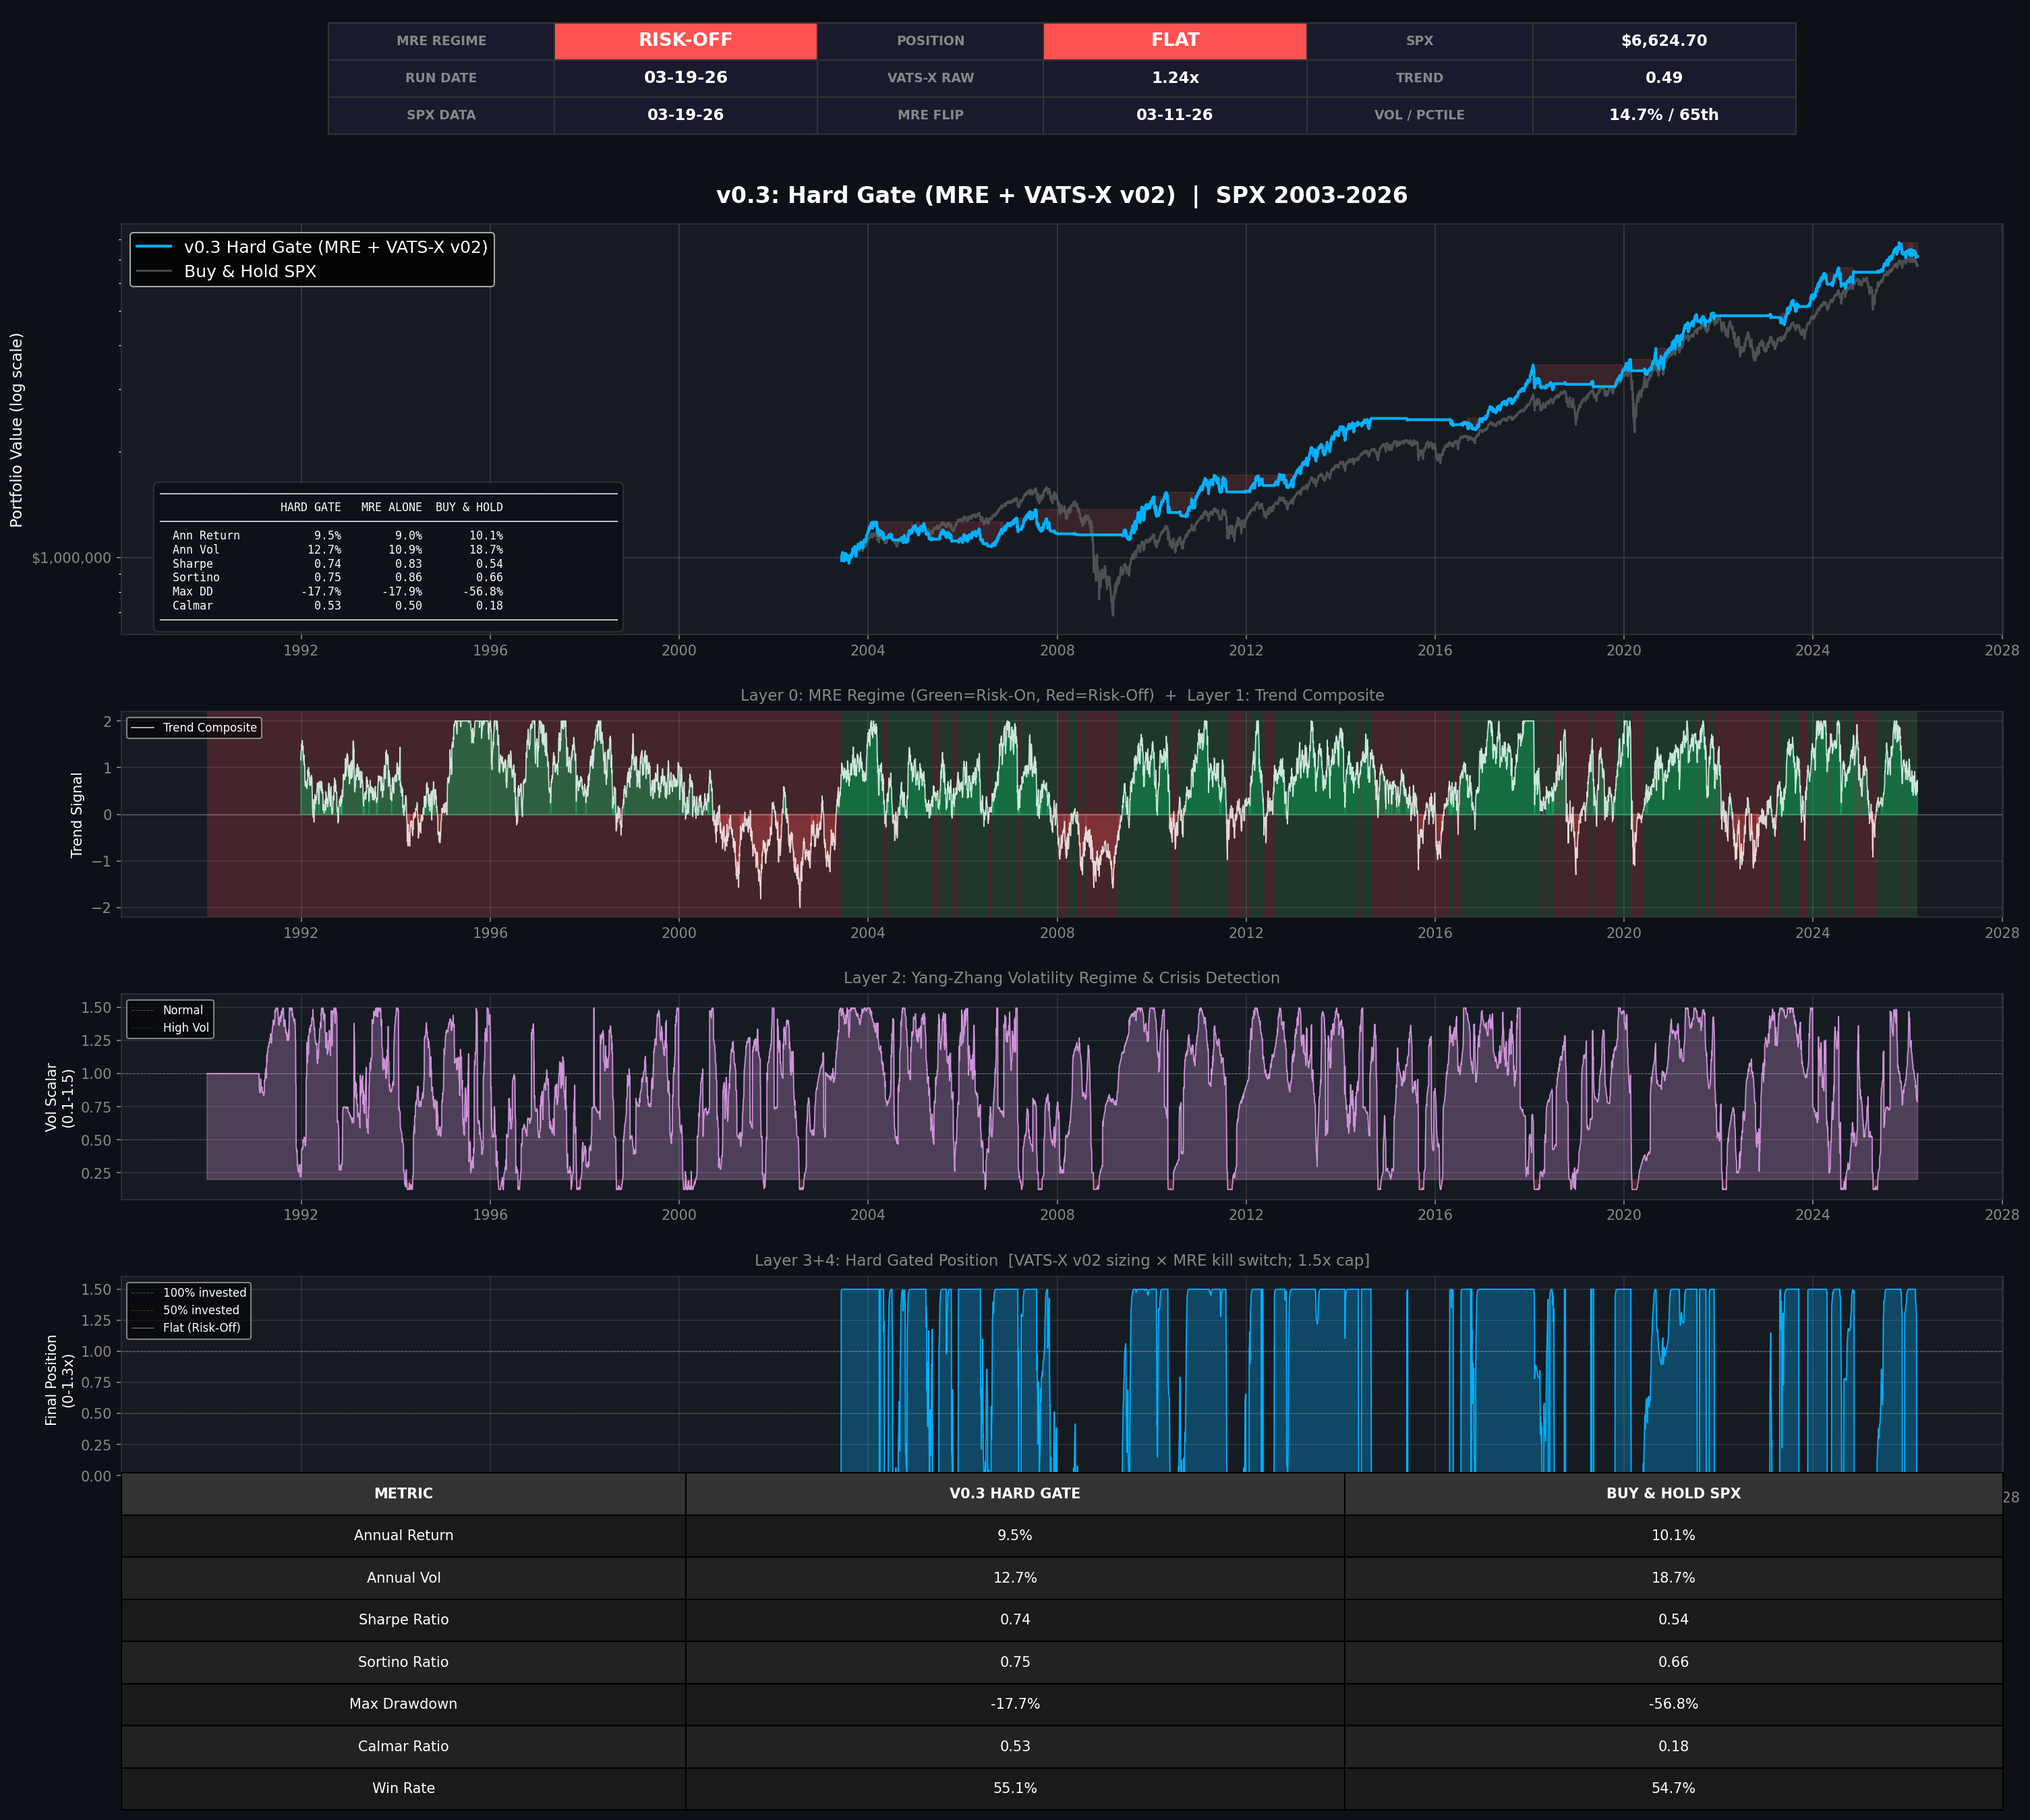
The Hard Gate beats both MRE alone AND buy-and-hold on final equity. It captures the vast majority of buy-and-hold’s return with dramatically less drawdown.
During the GFC, it barely dipped while the S&P cratered. During COVID, same story. During the 2022 bear, it was completely flat.
The Calmar ratio (return per unit of worst-case drawdown) improved roughly 3x over buy-and-hold. That’s the metric that matters most to me. It answers the question: how much return am I generating per unit of maximum pain?
Adding the Options Sleeve
Here’s where it gets a little nuts.
I’ve been running a bull put spread options strategy on SPY for a while now.. small percentage of total portfolio, 45 DTE entry, 21 DTE exit, kill switch tied to the MRE. It’s one of the most consistently profitable things I do (I wrote about it in detail previously).
The natural question: what happens when you layer that on top of the Hard Gate?
The answer: defined-risk leverage without margin. Instead of borrowing money at double-digit interest rates to get extra exposure, the options sleeve provides synthetic upside through premium collection during risk-on periods. Max loss is capped at the spread width minus premium received. No margin calls. No interest payments.
The options sleeve adds roughly 1% annual return on top of the stock sleeve at minimal additional drawdown. Not flashy. But it compounds.
The Full Portfolio: Everything Together
The final test was combining all three systems into a complete portfolio:
SPX: Hard Gate (VATS-X + MRE) with options sleeve
Bitcoin: The 8th Rule (my BTC trend system)
Gold: The 8th Rule (I’ll be releasing new settings this week that will allow you to use the 8th rule for going forward with excellent results)
Each asset has its own independent signal system. The MRE gates SPX. The 8th Rule gates Bitcoin & Gold. No single system controls the whole portfolio.. they vote independently.
I tested seven different allocation splits from 2014-2026. Every single configuration produced a Sharpe above 1.4 and a Calmar above 1.25. Let that sink in.
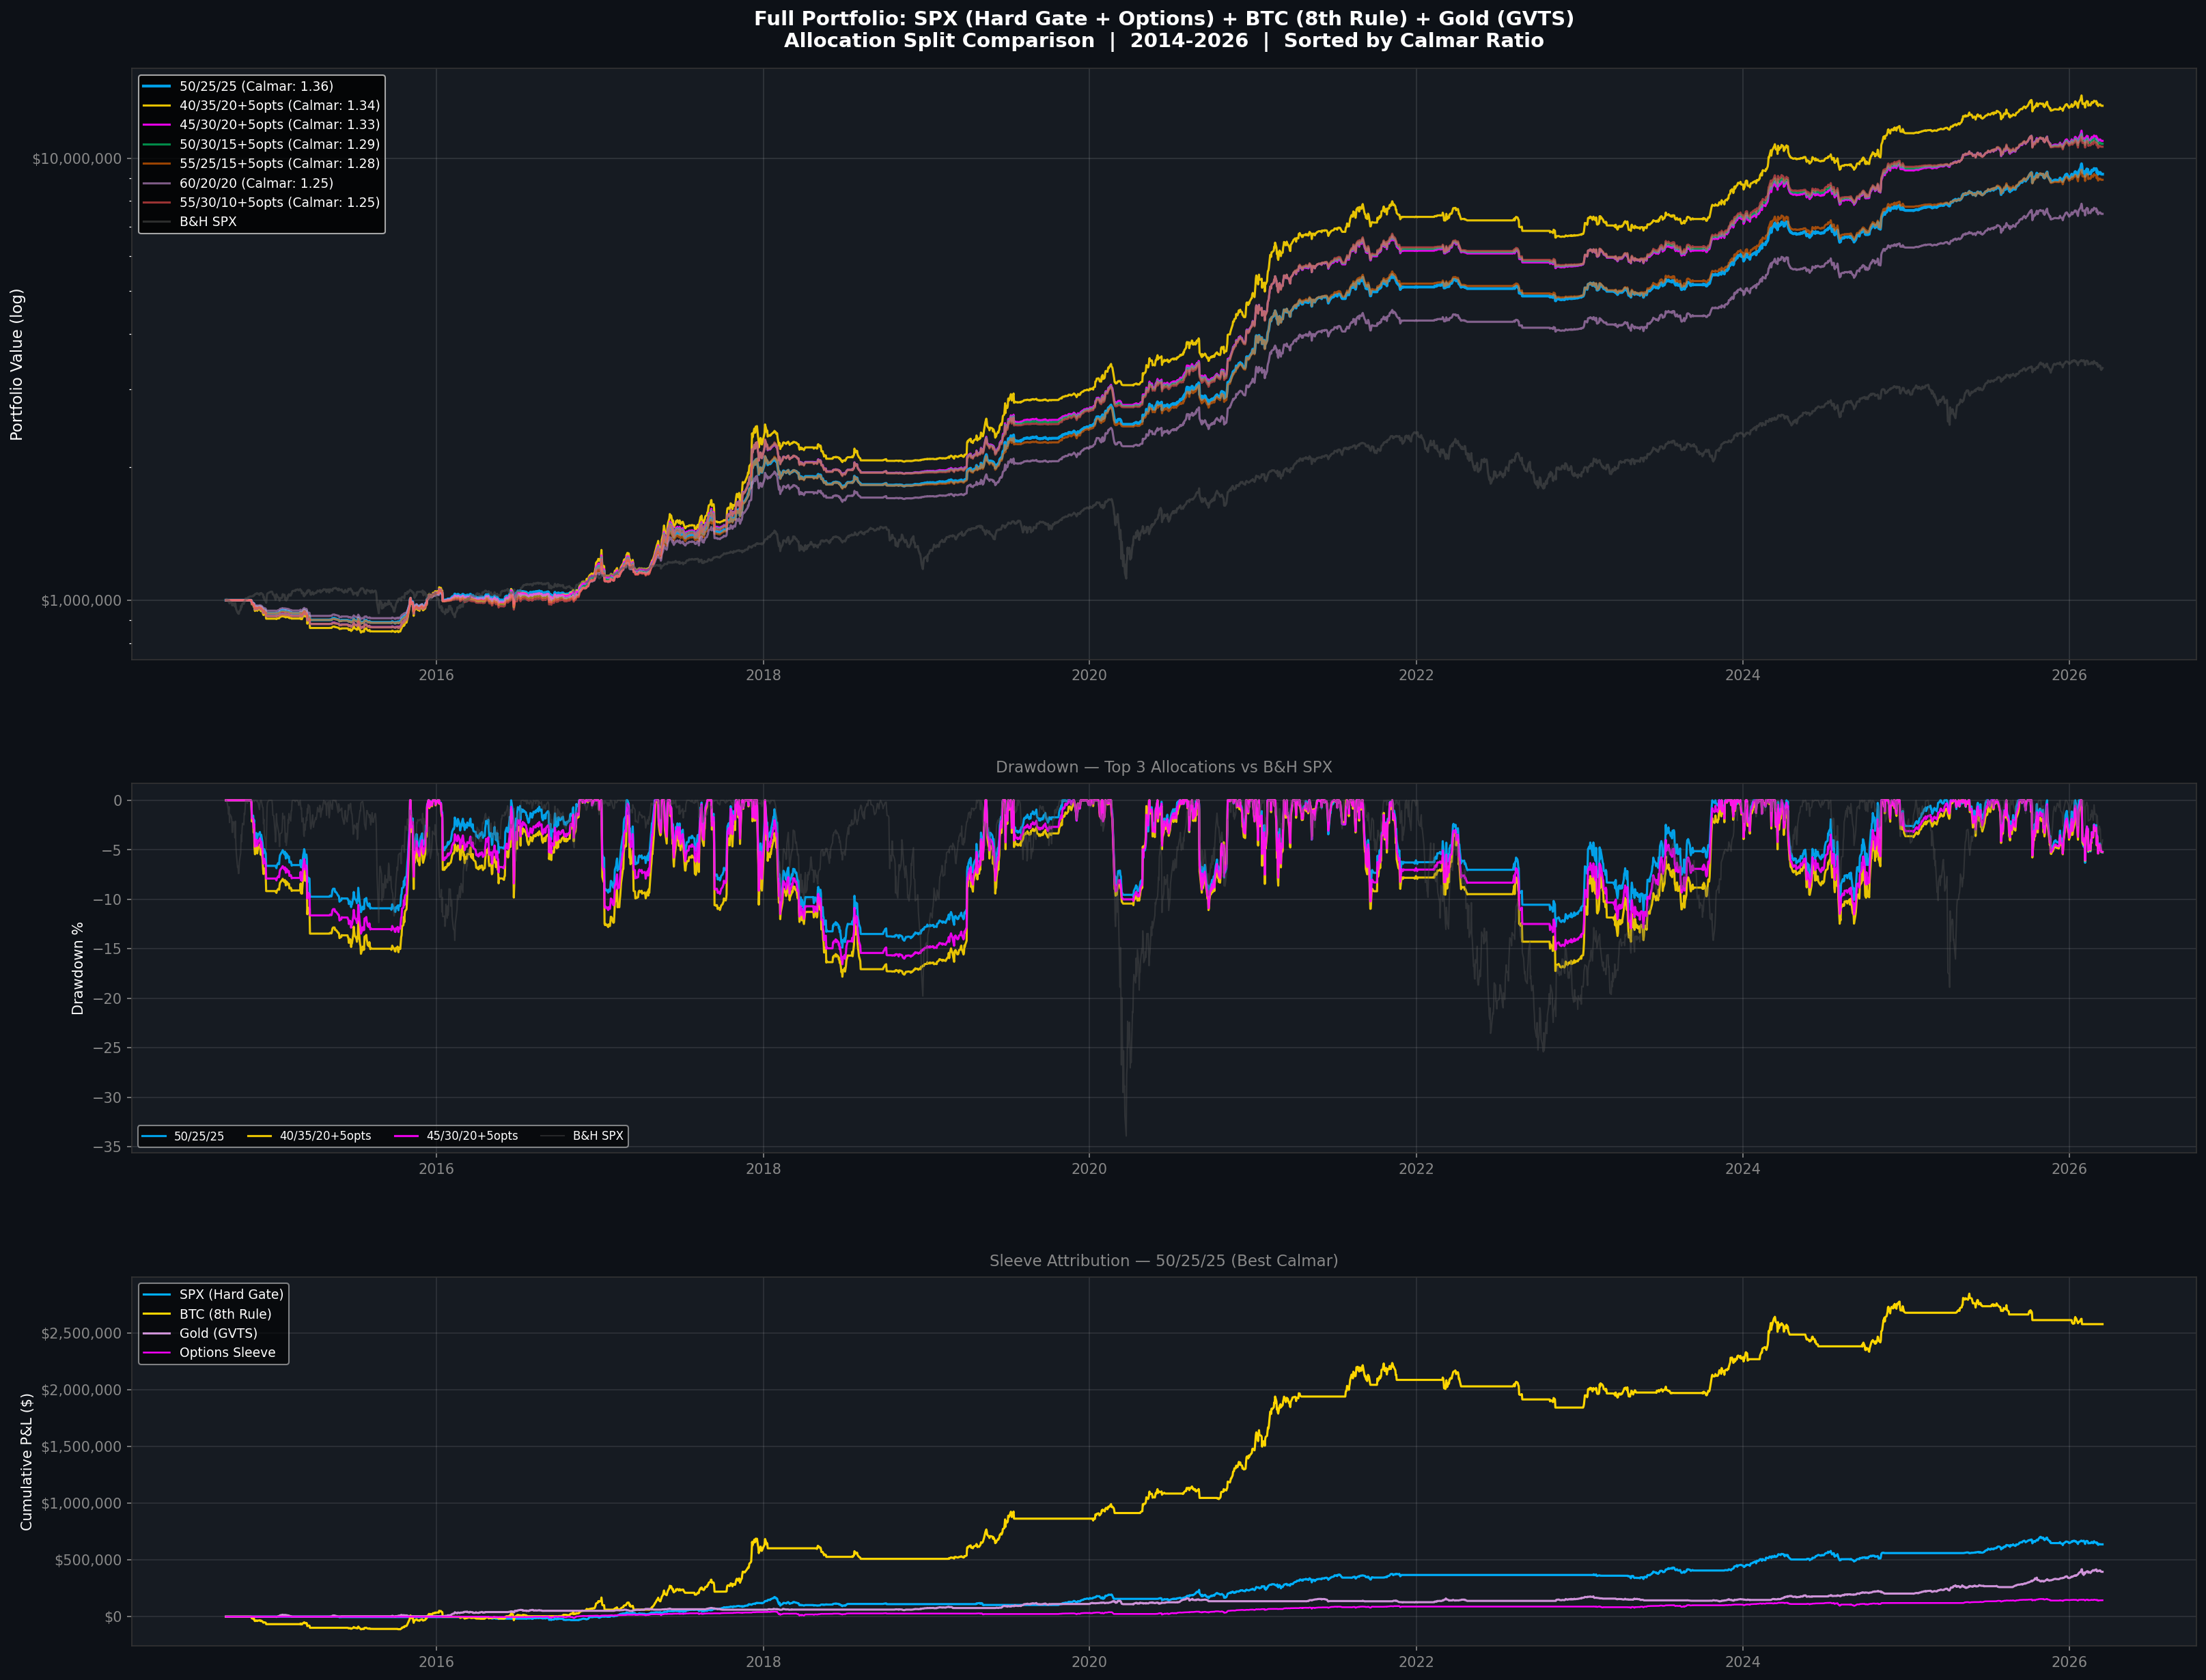
The optimal risk-adjusted allocation came down to a roughly equal split across the three asset classes.. slightly overweighting the alternative assets relative to where I started. The diversification benefit is massive because the three assets have low correlation during stress events.. when SPX drops, Gold tends to hold or rally, and BTC follows its own cycle driven by liquidity conditions.
My current allocation works. But the data showed that shifting some weight from SPX into BTC and Gold produces a better portfolio by every risk-adjusted metric at virtually the same drawdown. Sometimes the best optimization is the simplest one.
The new allocation I will be running going forward:
45%: $SPX (up to 1.5x on margin)
5%: Bull Put Spread
25%: BTC (no margin)
25%: Gold (no margin)
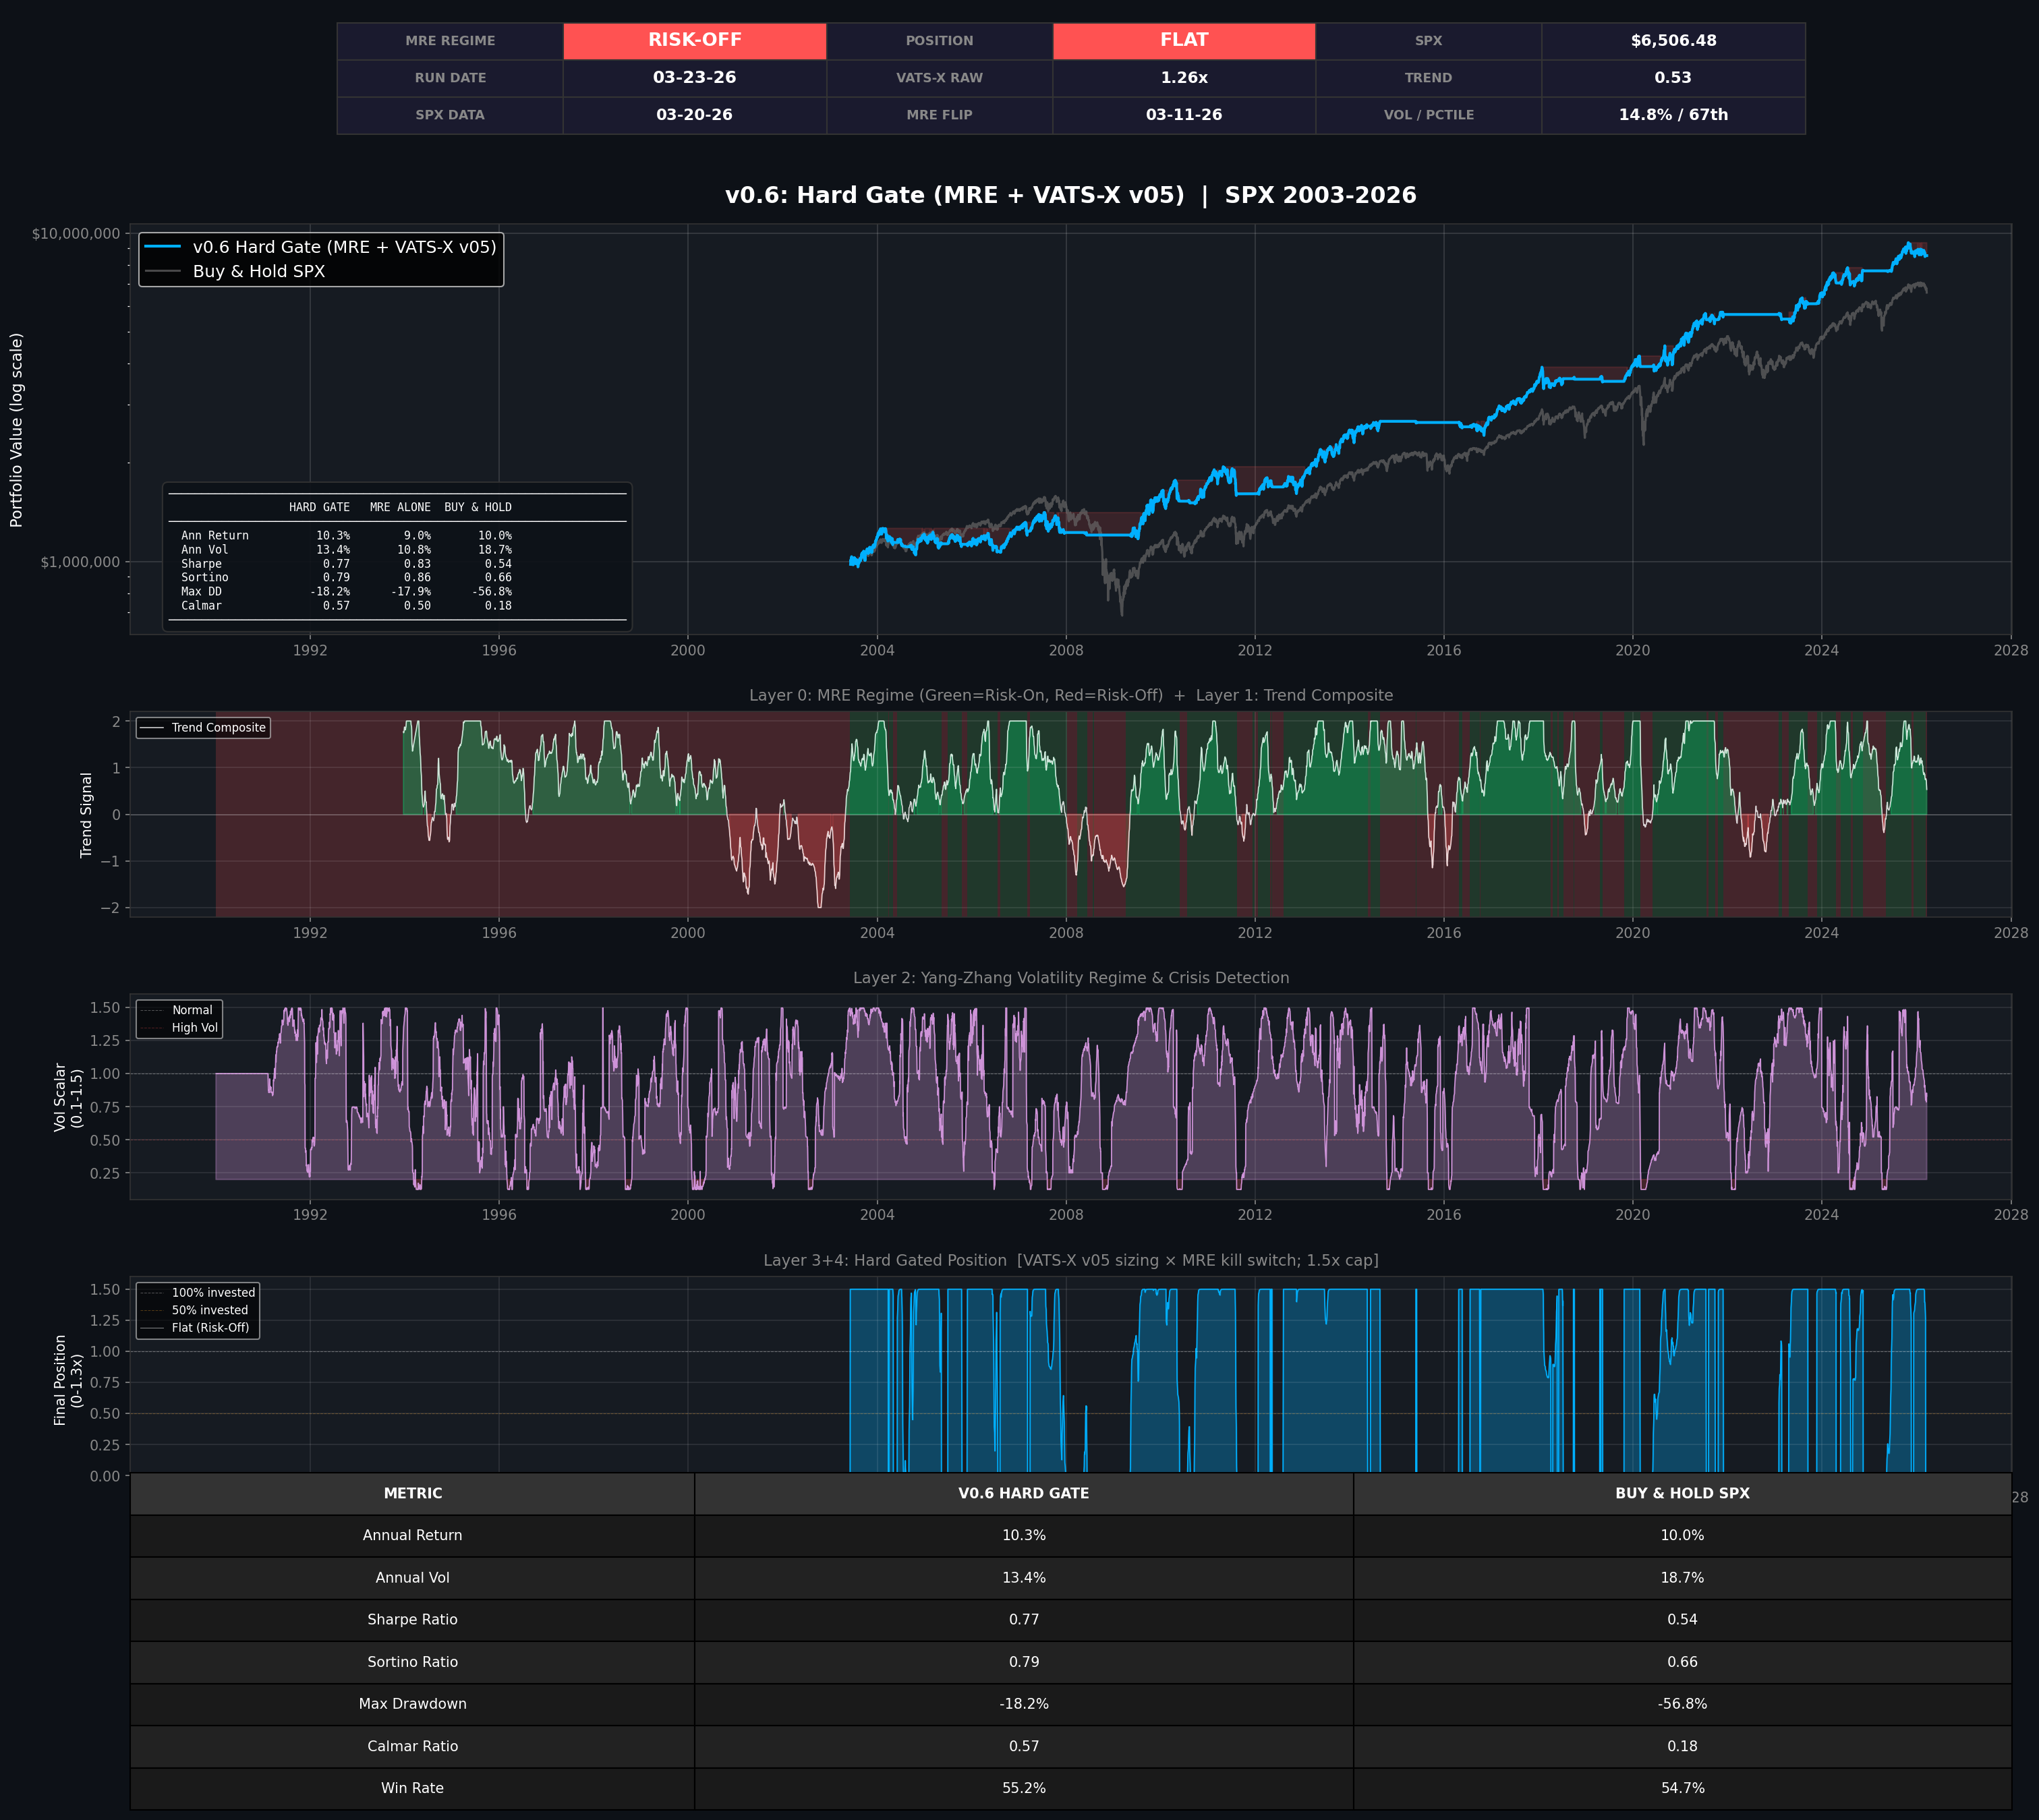
What’s Running Now
The system is live. Here’s the current state:
MRE: Risk-off since March 11, 2026. All equity positions sold. Cash parked earning yield.
8th Rule: Exited BTC in late January. Flat.
GVTS: Exited Gold last Friday (we’ll be switching to the 8th rule going forward).
VATS-X: Would size up immediately if MRE flips on. Currently gated at zero.
Options sleeve: Inactive (MRE risk-off kills all spreads).
The engine updates automatically. Price data appends daily. When MRE flips on TradingView, I update a single config file and run the engine. It tells me the exact position size in under 60 seconds.
A daily scheduled task runs after market close to refresh the data and confirm the signal.
A separate research job runs every morning, searching institutional papers and testing experimental improvements. Every experiment is logged, tracked, and versioned. The system gets smarter while I sleep.
I started drafting this article on Friday and it’s now Tuesday.. this research assistant has already found something that gives us even better returns. See screenshot:
More on this another time…
The Bottom Line
I started this project trying to copy someone else’s signal. I ended up building something that, by the numbers, stands on its own.
The edge isn’t any single indicator. It’s the architecture: three independent signal systems across three uncorrelated assets, each sizing positions continuously based on trend strength and volatility conditions, gated by macro regime filters that go to cash when the weather turns.
Systems within systems. Edges stacked on edges. That’s the whole game.
Please see the links in the footnotes for the actual research papers cited/used to during my build process.
Fin.
Stay sovereign. Don’t be exit liquidity.
— Durden out. ✊🧼
Want the live dashboards behind these insights?
Subscribe on Substack Free subscribers get research updates. Paid subscribers get live macro tools + signal alerts.