In the utterly brutal, eternally decaying alpha arena that is investing there are only two ways to lose money. The first is being wrong, easy. The second is thinking you’re right because your ‘live map’ doesn’t match the battlefield, hard.
For the last few weeks, I’ve been obsessed with a single question:
At first glance it looked like the Holy Grail.
Then, I realized it was lying to me.
Here is the (short) story of building my Macro Regime Engine, breaking it, and rebuilding it into something that might actually survive (and perform) in the real world.
Strap in because I’ve got a ton of backtest results & charts to share.
(If you want to just skip to the results, scroll to the end of the article but at least give me a like ye’ lazy bastard).
Phase 1: The “Perfect” Equity Curve
The concept was simple and inspired by the institutional frameworks used by shops like 42Macro. Markets move based on the intersection of two forces:
Growth and Inflation.
Each could either be rising or falling, so I saw that by finding four different investment strategies — each one of which would do well in a particular environment (rising growth with rising inflation, rising growth with falling inflation, and so on) — I could construct an asset-allocation mix that was balanced to do well over time while being protected against unacceptable losses.
Since that strategy would never change, practically anyone could implement it.
— Ray Dalio
If you cross them, you get four distinct regimes:
Goldilocks (Growth Up, Inflation Down): Long everything.
Reflation (Growth Up, Inflation Up): Long commodities and equities.
Inflation (Growth Down, Inflation Up): Cash is king.
Deflation (Growth Down, Inflation Down): Run for cover.
I began coding this into PineScript on TradingView using a rudimentary voting system.
I took a basket of assets:
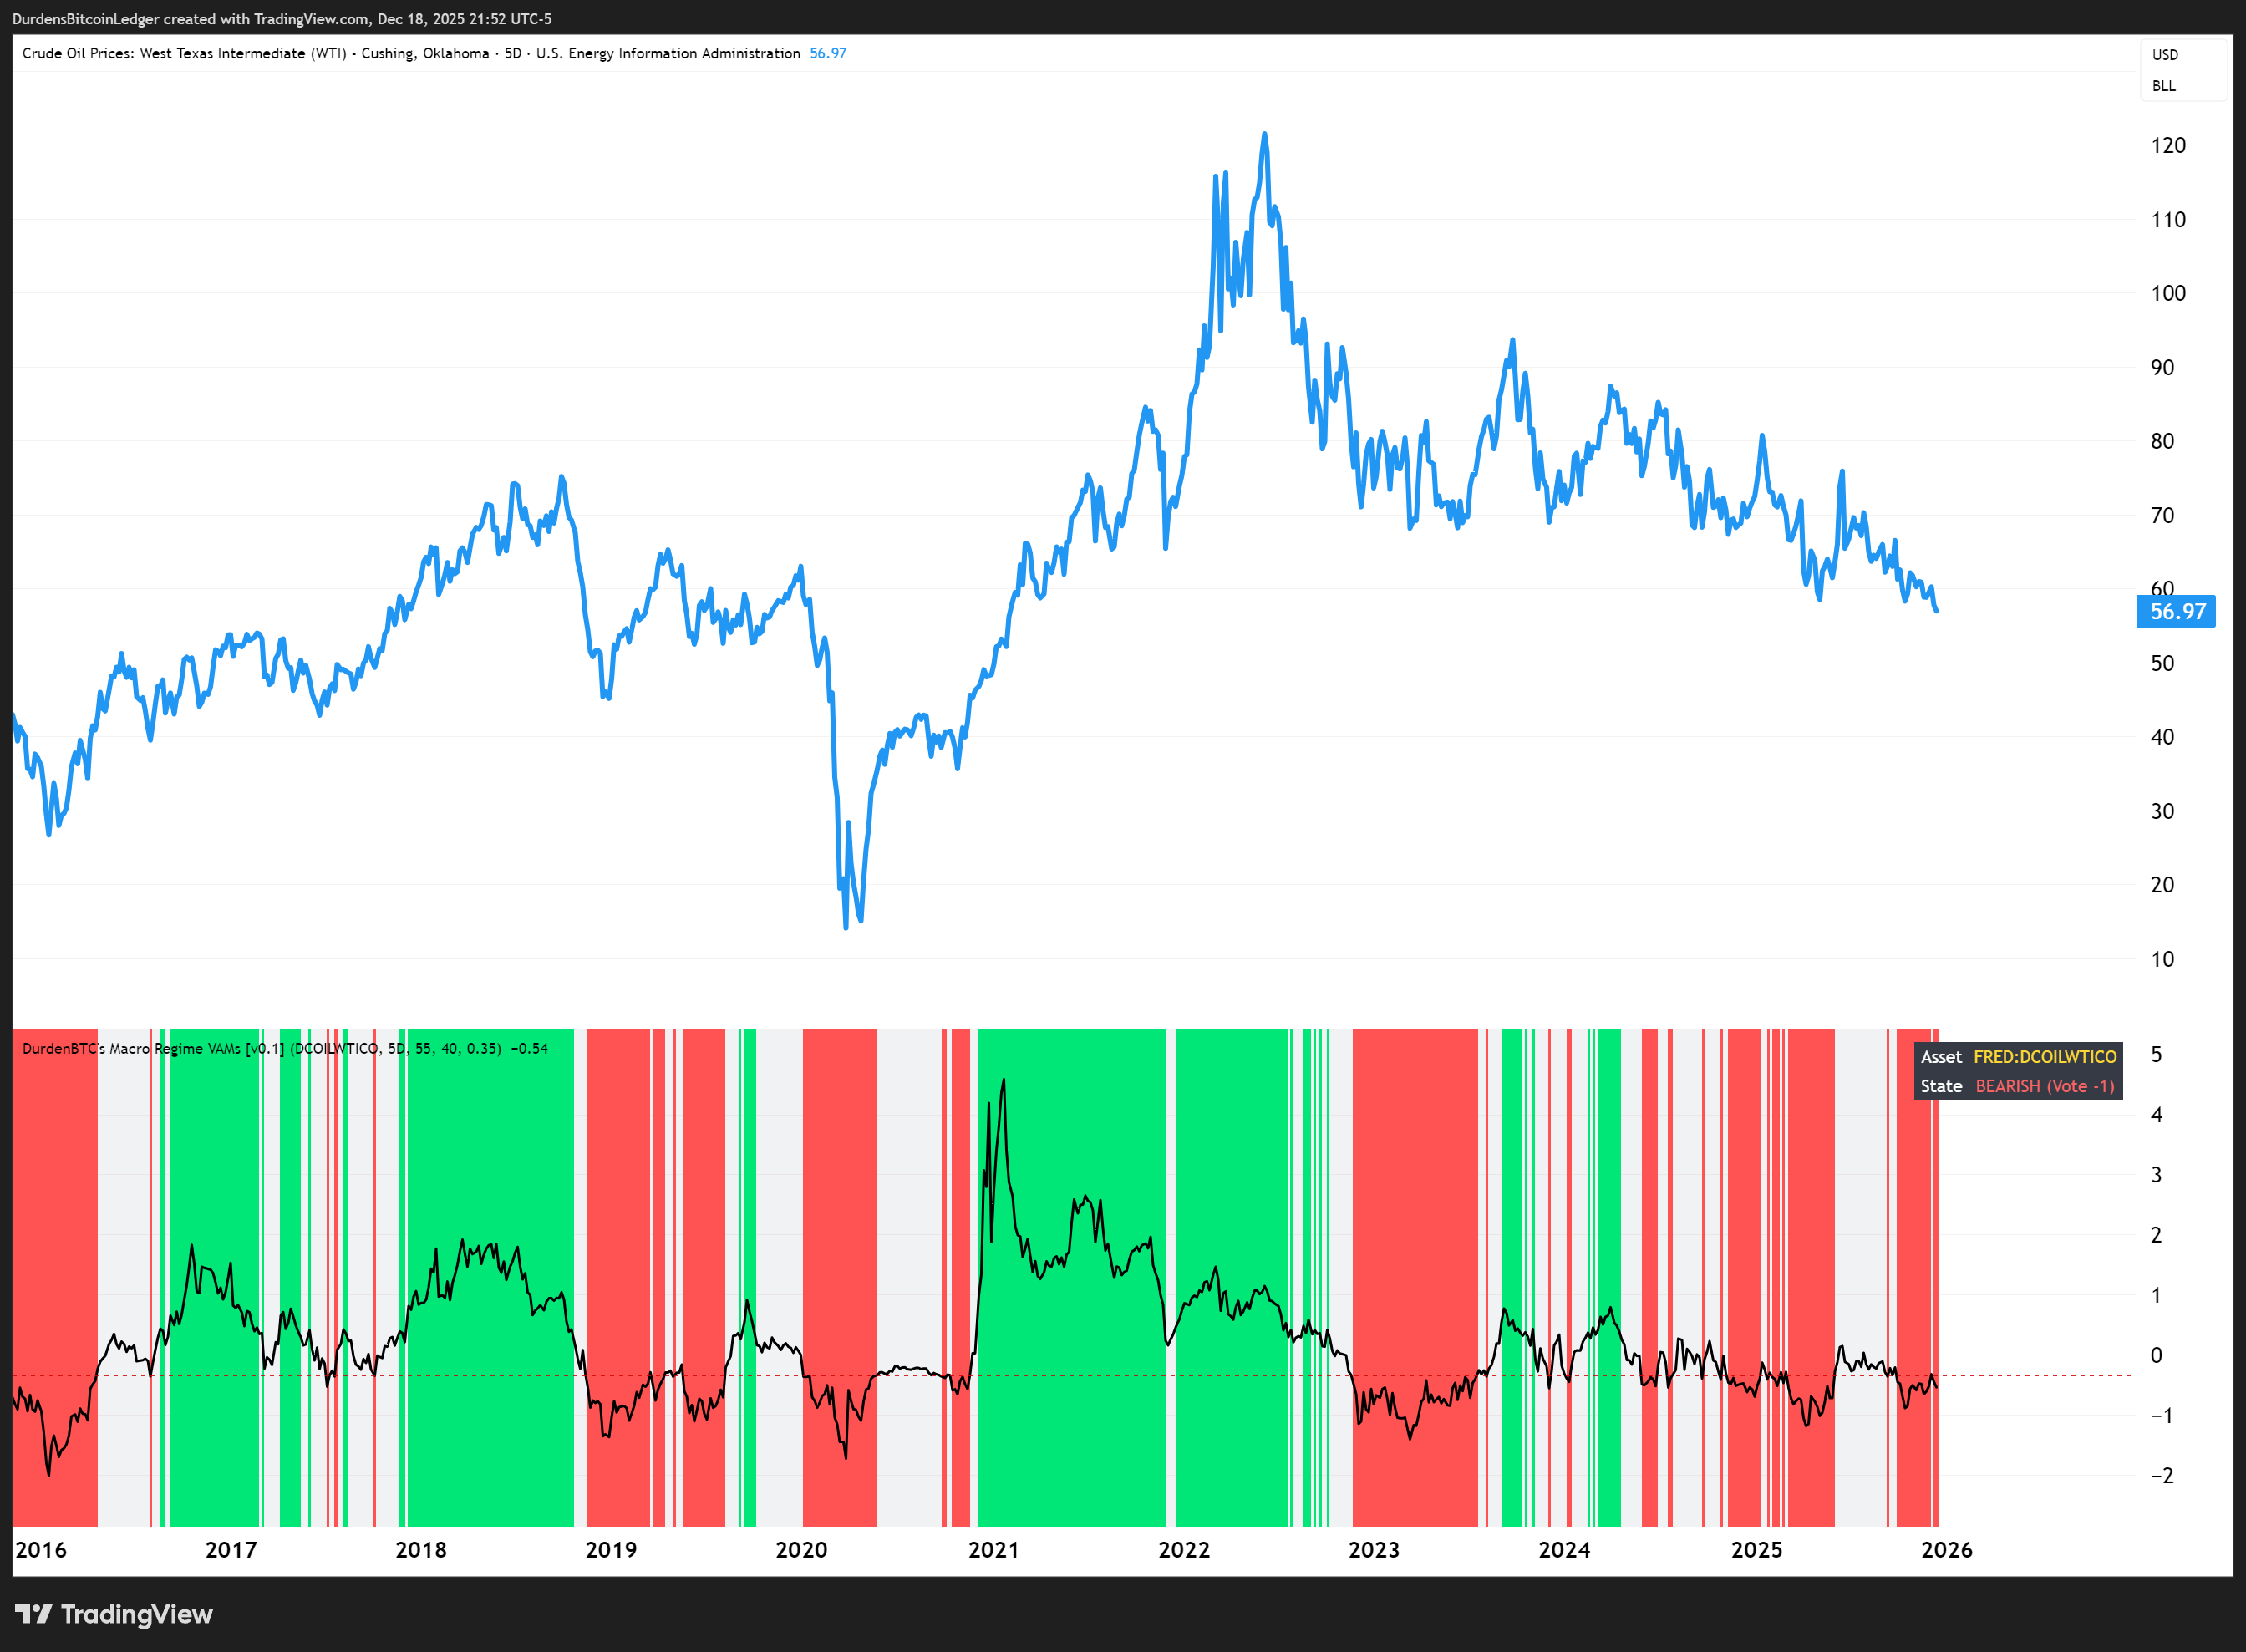
High Yield Credit Spreads (for growth)
Oil (for inflation)
the Dollar (for deflation)
and about 18 others
If the majority “voted” bullish on Growth and bearish on Inflation, the engine flipped to Goldilocks.
The voting was determined via each assets current ‘state’ (bullish, chop/neutral or bearish) through the lens of a vol-adjusted momentum indicator.
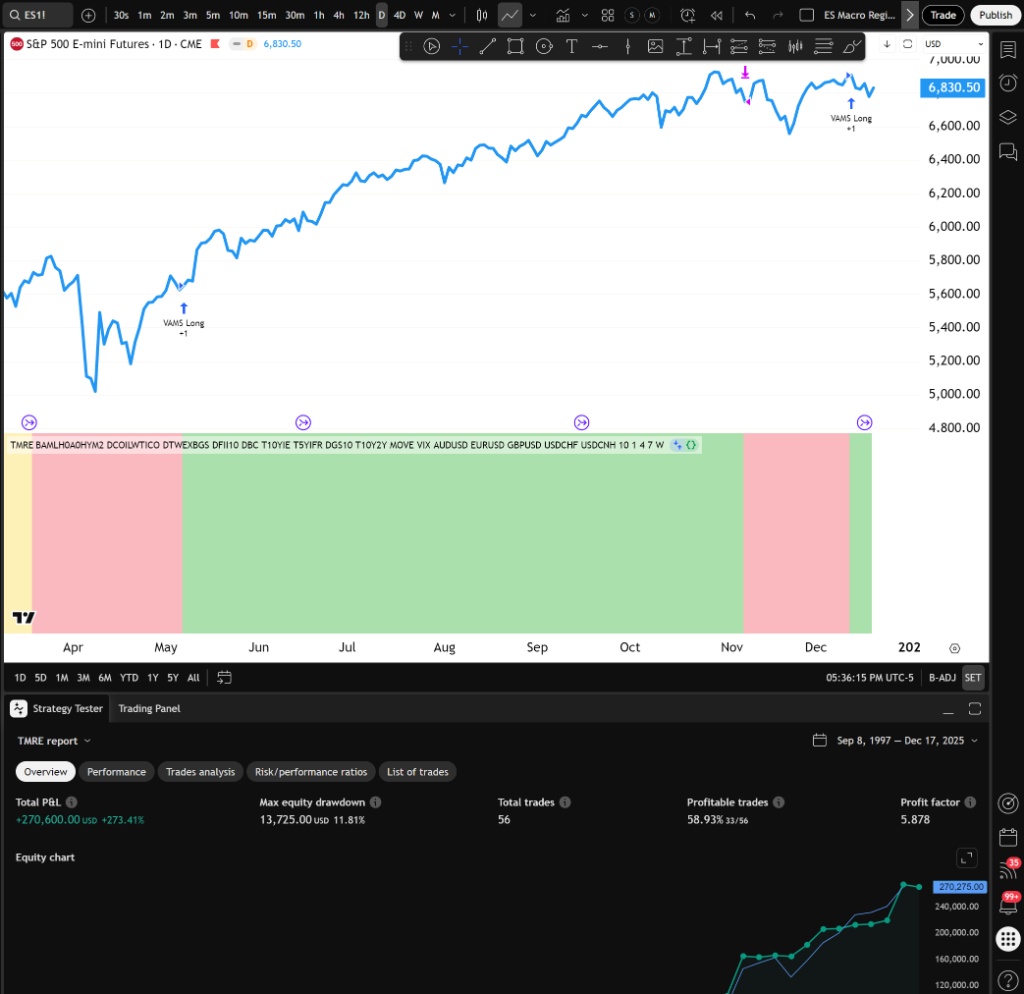
I ran the backtest. Profit Factor: 5.87. Max Drawdown: ~11.8%. Equity Curve: A straight line up, ignoring 2008, 2020, and 2022.
I felt like I had solved the market. I was ready to mortgage the house.
Phase 2: “Future Leak” (aka the Reality Check)
The backtest (above) looks “good” (smooth upward line, minimal drawdown). That’s solely because the script is suffering from repainting. Repainting isn’t a difficult concept but is overlooked by many PineScript strategies/indicators.
Let’s look at an example to clear up any confusion:
My script was running on a Daily chart, but it was pulling Weekly macro data on certain inputs to filter out the noise. The problem? When the script ran the backtest and asked the server on a Tuesday: “Hey, what did the Weekly candle look like?”
The server, knowing history, would reply: “Well, by Friday, this candle closed Green.”
My strategy was buying on Tuesday based on Friday’s future close during the backtest trading. Big oopsie. I tossed these results in the garbage.
It’s easy to have a ~5.8 Profit Factor when you’re betting on a game that has already finished.
Phase 3: The Fix (And the Pain)
I had to “full-proof” the code. I rewrote the engine with a strict rule: You can only make decisions based on data that is 100% closed and in the books.
If I’m trading on Tuesday, I can’t look at the current week. I can only look at last week’s closed candle.
How to stop repainting in PineScript:
When requesting higher timeframe (ie: Weekly while on a Daily chart) data, we must strictly request the previous closed bar's data (
[1]) usinglookahead=barmerge.lookahead_on.
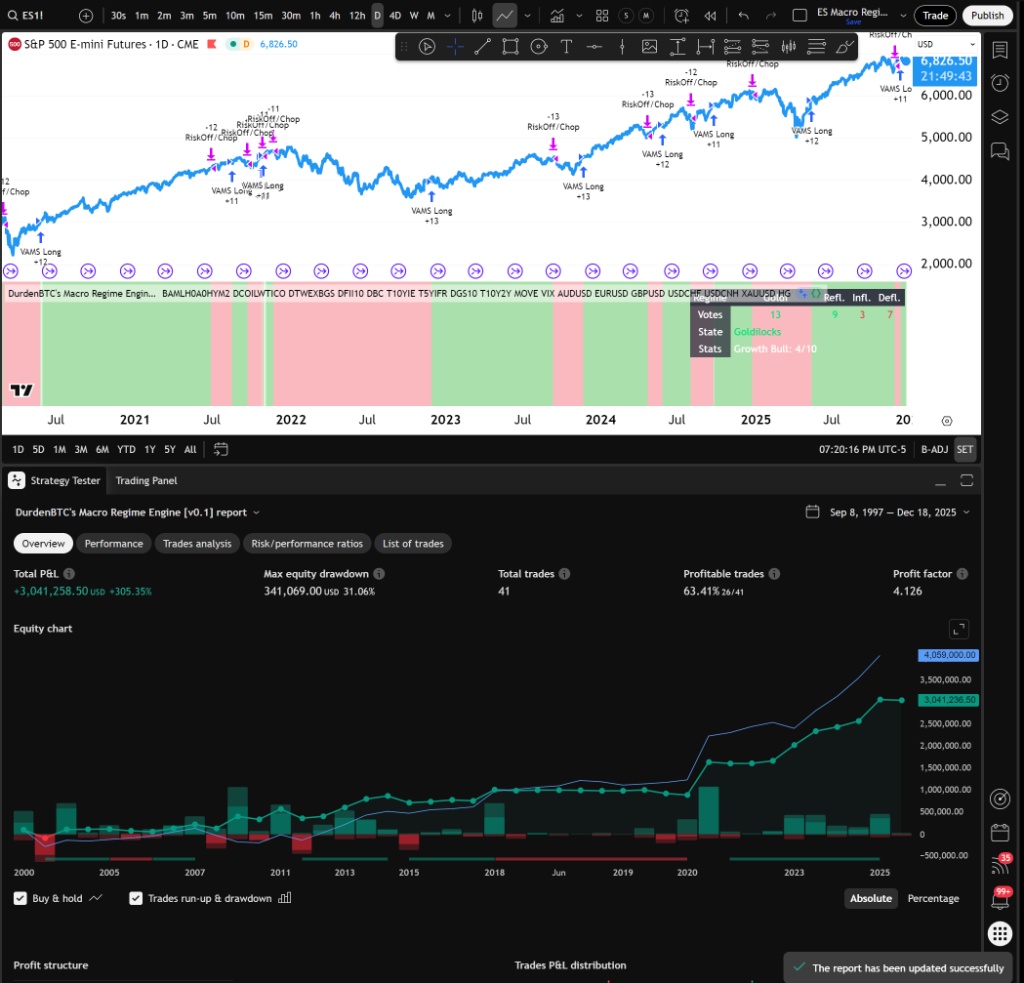
I re-ran the backtest with the non-repainting logic. The result? The “perfect” line became jagged. The drawdown more than doubled to 30%. The Profit Factor dropped to 4.3.
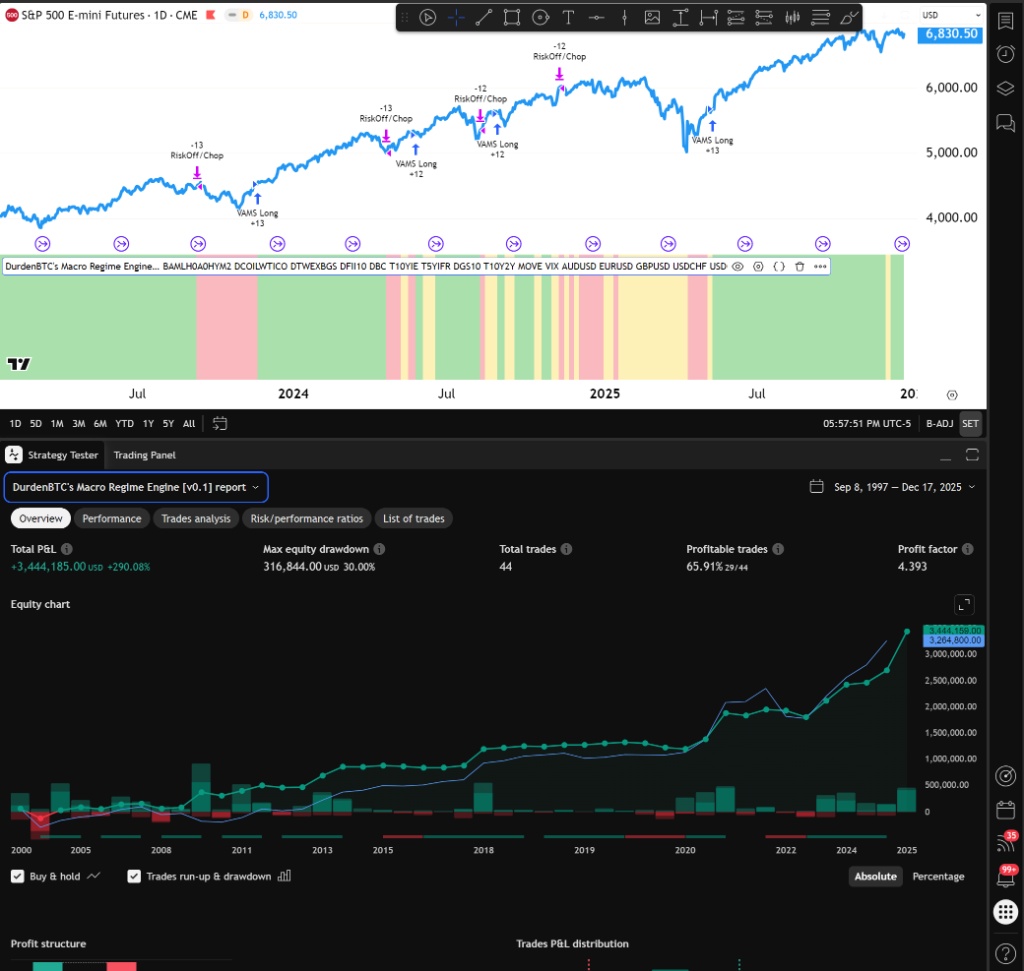
It hurt to look at. But for the first time, the chart was real. A 4.3 Profit Factor on a daily timeframe is still decent, but it wasn’t magic anymore. It was just a lukewarm strategy.
Phase 4: The “5D” Eureka Moment
This is where things got interesting. I was trying to optimize the lag. Weekly data felt too slow.. if the market crashes on Monday, I didn’t want to wait until Friday/next Monday to sell.
I started testing weird timeframes.
1-Day data: Too noisy. Too many fake-outs.
2-Day data: Not bad but increased the amount of trades per year dramatically, adding a lot of whipsaw.
3-Day data: The performance tanked (relatively) compared to longer timeframes.
4-Day data: Much better, moving in the right direction in terms of stability & performance.
5-Day data: Holy shit.
The 5D timeframe outperformed everything. Not only did it beat buy & hold without pyramiding but it slashed the maximum drawdown to ~14% with only 41 trades since 1997.
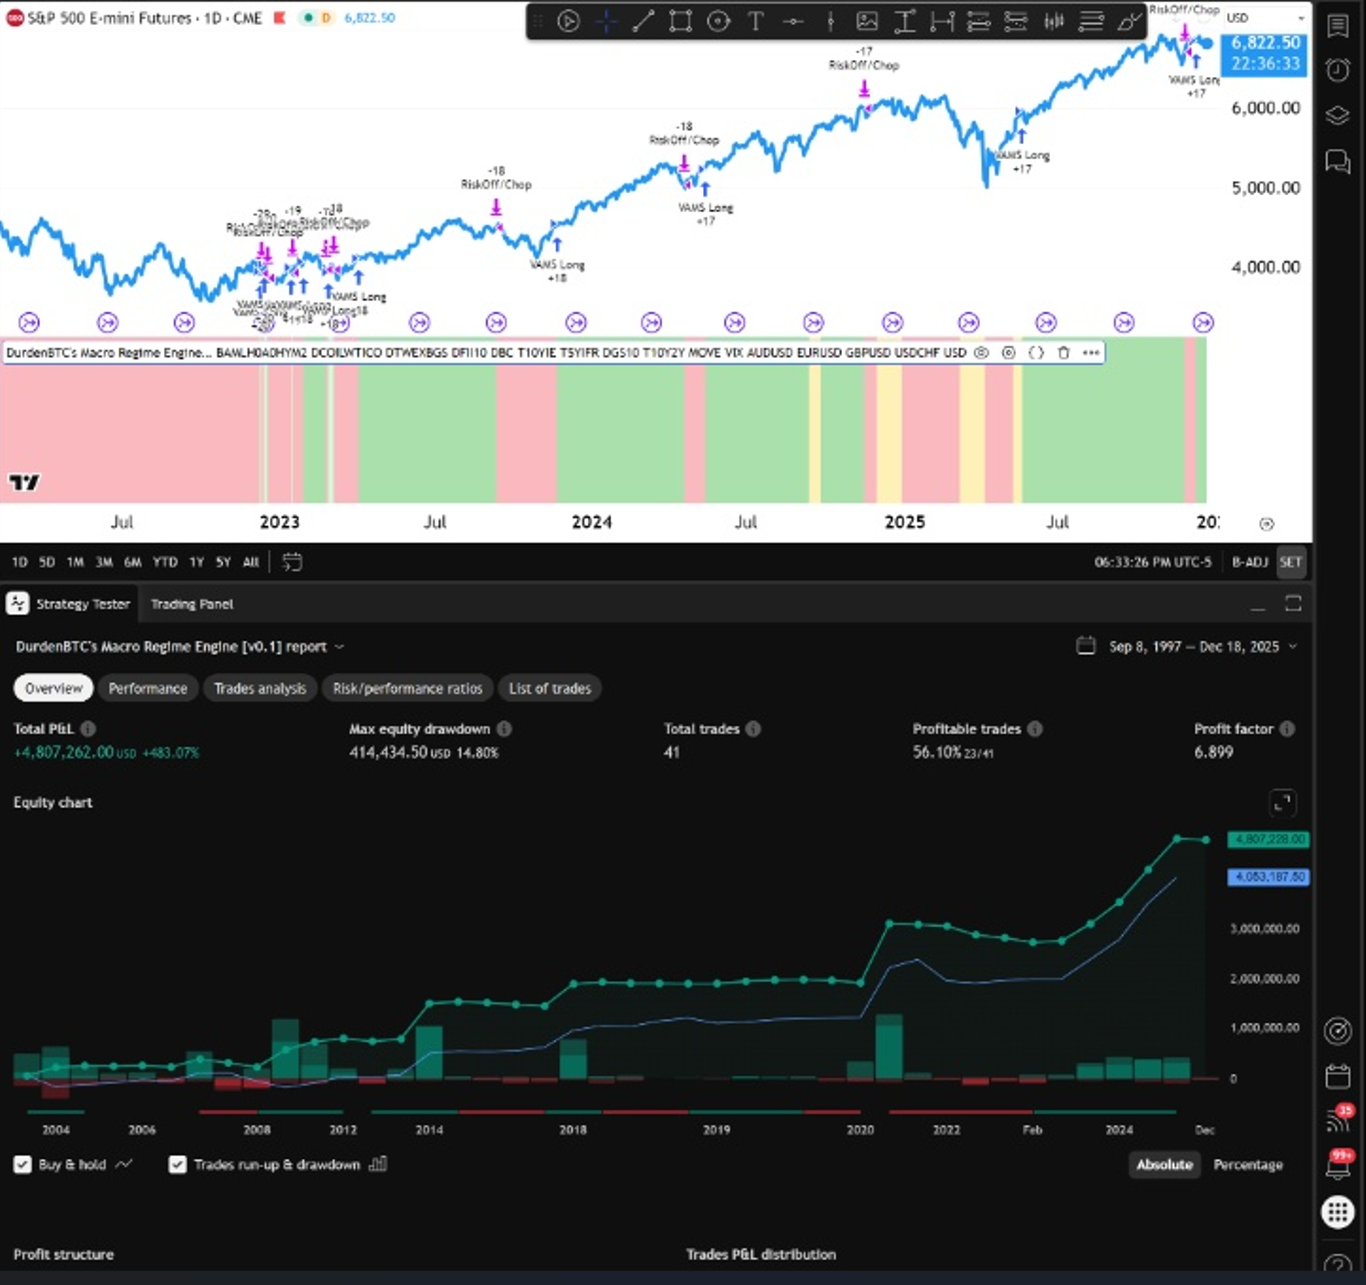
Why? Because the market is a macro ocean where the tides & waves shift in weeks. A 3-Day cycle fights the rhythm of the business week. A 5-Day cycle aligns with it. By forcing the engine to wait for a 5-Day “block” to close before changing its mind, I accidentally created the ultimate noise filter.
In 2020 (COVID) and 2008 (GFC), the market didn’t go straight down every single day. It crashed, bounced (head fake), and crashed again. My faster settings (2D) got whipsawed; selling the crash, buying the bounce, selling the crash again.

The 5D setting was “dumb” enough to ignore the bounce. It saw the week started bad and ended bad, so it stayed out. Sometimes, being a bit slow is a superpower.
Phase 5: Signal vs. Noise (The German Bund Incident)
I tried to get fancy. I added the German 10Y Bund to the model to get a “global” view of deflation.
The strategy immediately broke. Entire months of data turned into flat grey lines on the individual chart & the strategy overall took a nose-dive.
The culprit? Negative Interest Rates. Between 2019 and 2021, German yields went negative. My volatility formula uses logarithmic returns. You cannot take the log of a negative number. The math literally crashed, returned NaN (Not a Number), and the engine shut down.
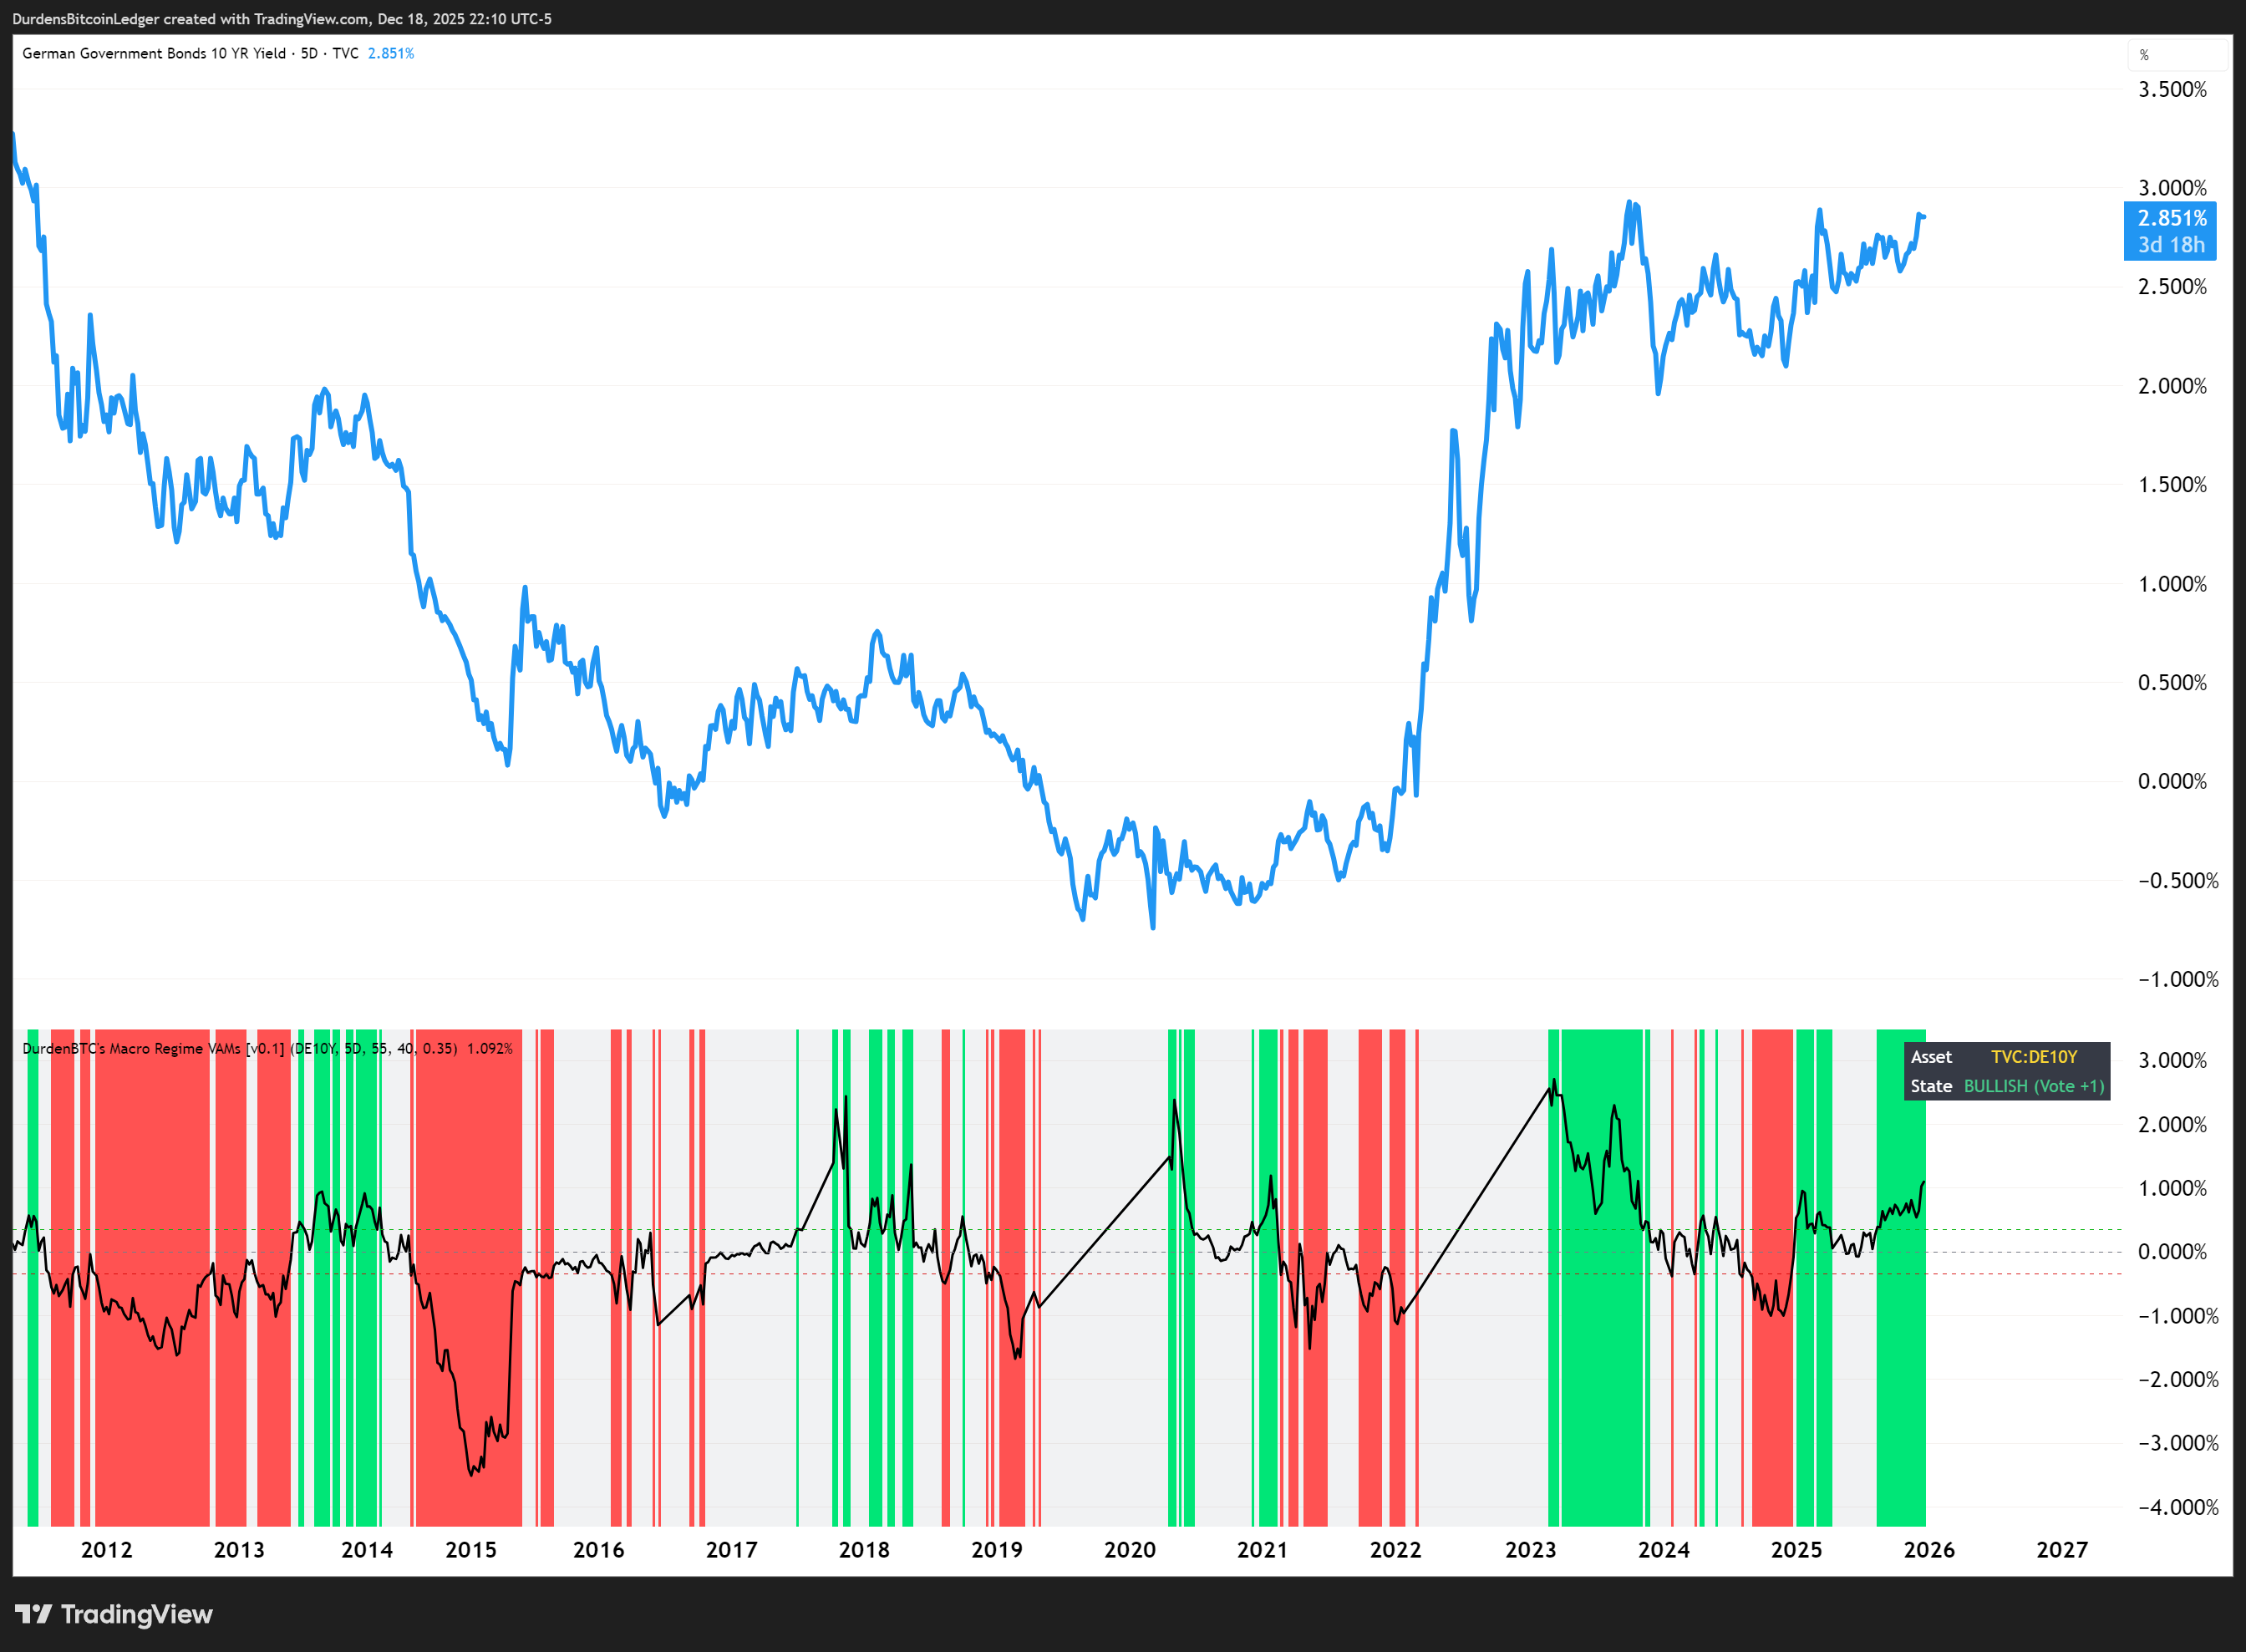
It was a sign. The Bund wasn’t adding signal; it was adding noise (and math errors). European bonds are often less volatile or lag behind US bonds as well. I cut it and just left my original set of 20+ assets.
The result was immediate. I understood I had to keep things focused & optimized specifically for US equities namely the S&P 500.
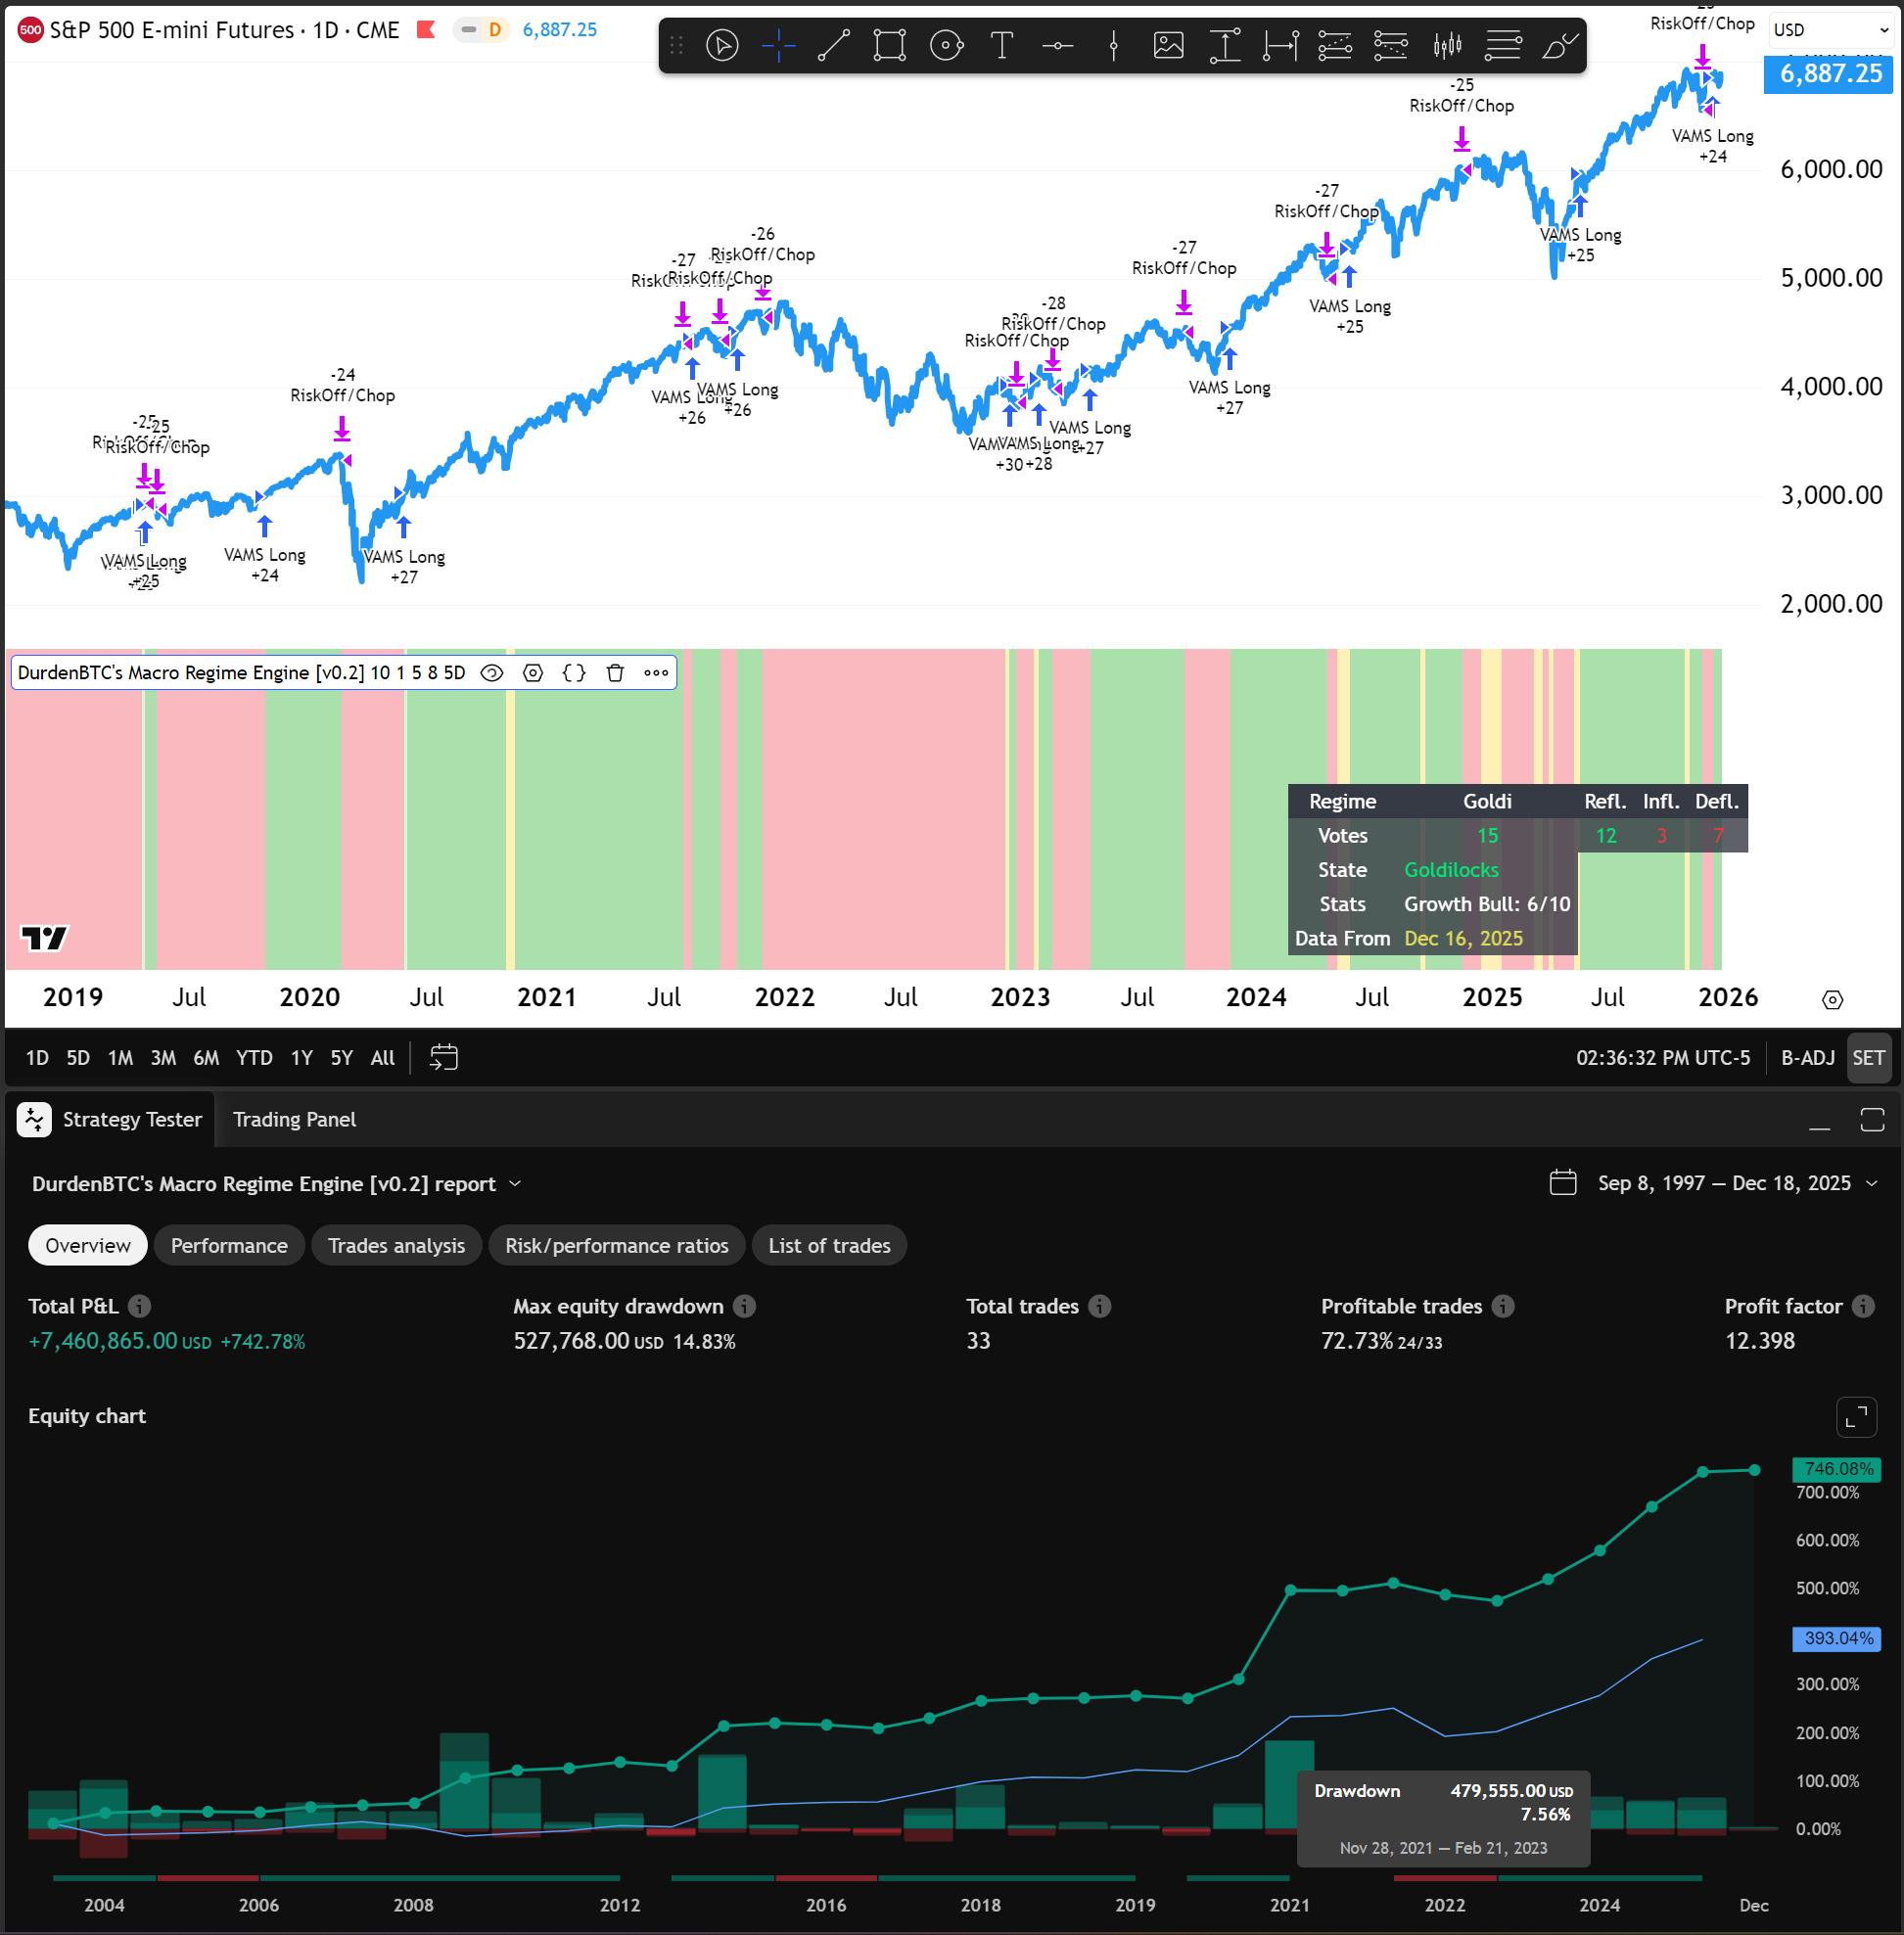
The “Holy Grail” v0.2 Backtest Results
With the journey to this point out of the way, I want to share where I’m currently at with the engine as of this writing.
Here is a breakdown of the current stats & receipts:
Does not repaint. (It never cheats).
Uses individually tuned Volatility Adjusted Momentum signal to normalize asset moves.
Votes across 20+ assets (Equities, Credit, Oil, Bonds, USD, etc.).
Operates on a 5-Day heartbeat to filter out the noise.
The final stats on the backtest (ES1! Futures from 1997 onwards):
Max Drawdown: ~14.8% (vs ~50% for S&P 500 Buy & Hold).
Profit Factor: 12.398.
Total Return: +742.78% vs Buy & Hold 393.04%.
Total Trades: 33
Profitable Trades: 72.73%
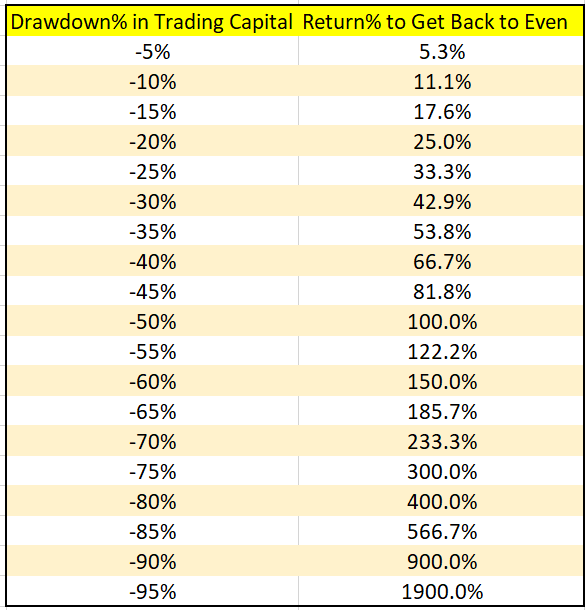
But the returns (while spectacular) aren’t the point. The point is the max drawdown.
This strategy isn’t designed to make me a billionaire in a month. It’s designed to ensure that when the next 2008 happens, I’m sitting in Cash, Treasuries or Gold while the world burns, waiting for the “Goldilocks” signal to flash so I can buy the ashes.
In a survival portfolio, avoiding the zero is the only alpha that matters.
What’s Next?
To understand markets is to understand that you’re fighting a constant uphill battle. Just as no one can live forever so true rings the saying in investing:
All alpha decays.
This will continue to be a work in progress as I optimize each asset further individually and continue backtesting while figuring out the best path forward.

I have a couple of ideas for optimizations but haven’t yet decided what the best way to implement some of these is:
Conviction Sizing (size higher when more markets confirm)
Volatility Targeting (requires a bit of math but should smooth the ride significantly)
Asset Rotation (turns it into a full “Hedge Fund in a Box”)
I think at the most basic intuition a next step could be something like this. Depending on whatever the current signal is you’d make various portfolio constructions that can take advantage of Inflationary/Deflationary regimes by opting out of sitting cash and instead still making some gains on our money by being long things like bonds (VGSH, VGIT, IEF) or gold.
Fin
If you made it this far.. thanks so much for taking the time out to read the article! I really appreciate it. Feel free to leave a comment or reach out to me on X.
Want the live dashboards behind these insights?
Subscribe on Substack Free subscribers get research updates. Paid subscribers get live macro tools + signal alerts.