It’s so over. We’re so back. I don’t even know what to think anymore.
That’s how this week felt for most of crypto Twitter.. and honestly, that emotional whiplash is exactly why systems exist. Bitcoin ripped almost 10% on Wednesday, the timeline erupted with “we’re so back” energy, and within 48 hours we retraced right back to ~$66K. Meanwhile, I checked the signal, saw red across the board, and went back to building charts.
This week I’m sharing four new valuation models I’ve been working on.. all of which are reading at historic extremes. The kind of levels we haven’t seen in Bitcoin’s entire meaningful price history. Every single one of them says “generational value,” and the trend system still says “don’t touch it.”
Let’s unpack that.
Executive Summary & This Week’s Highlights
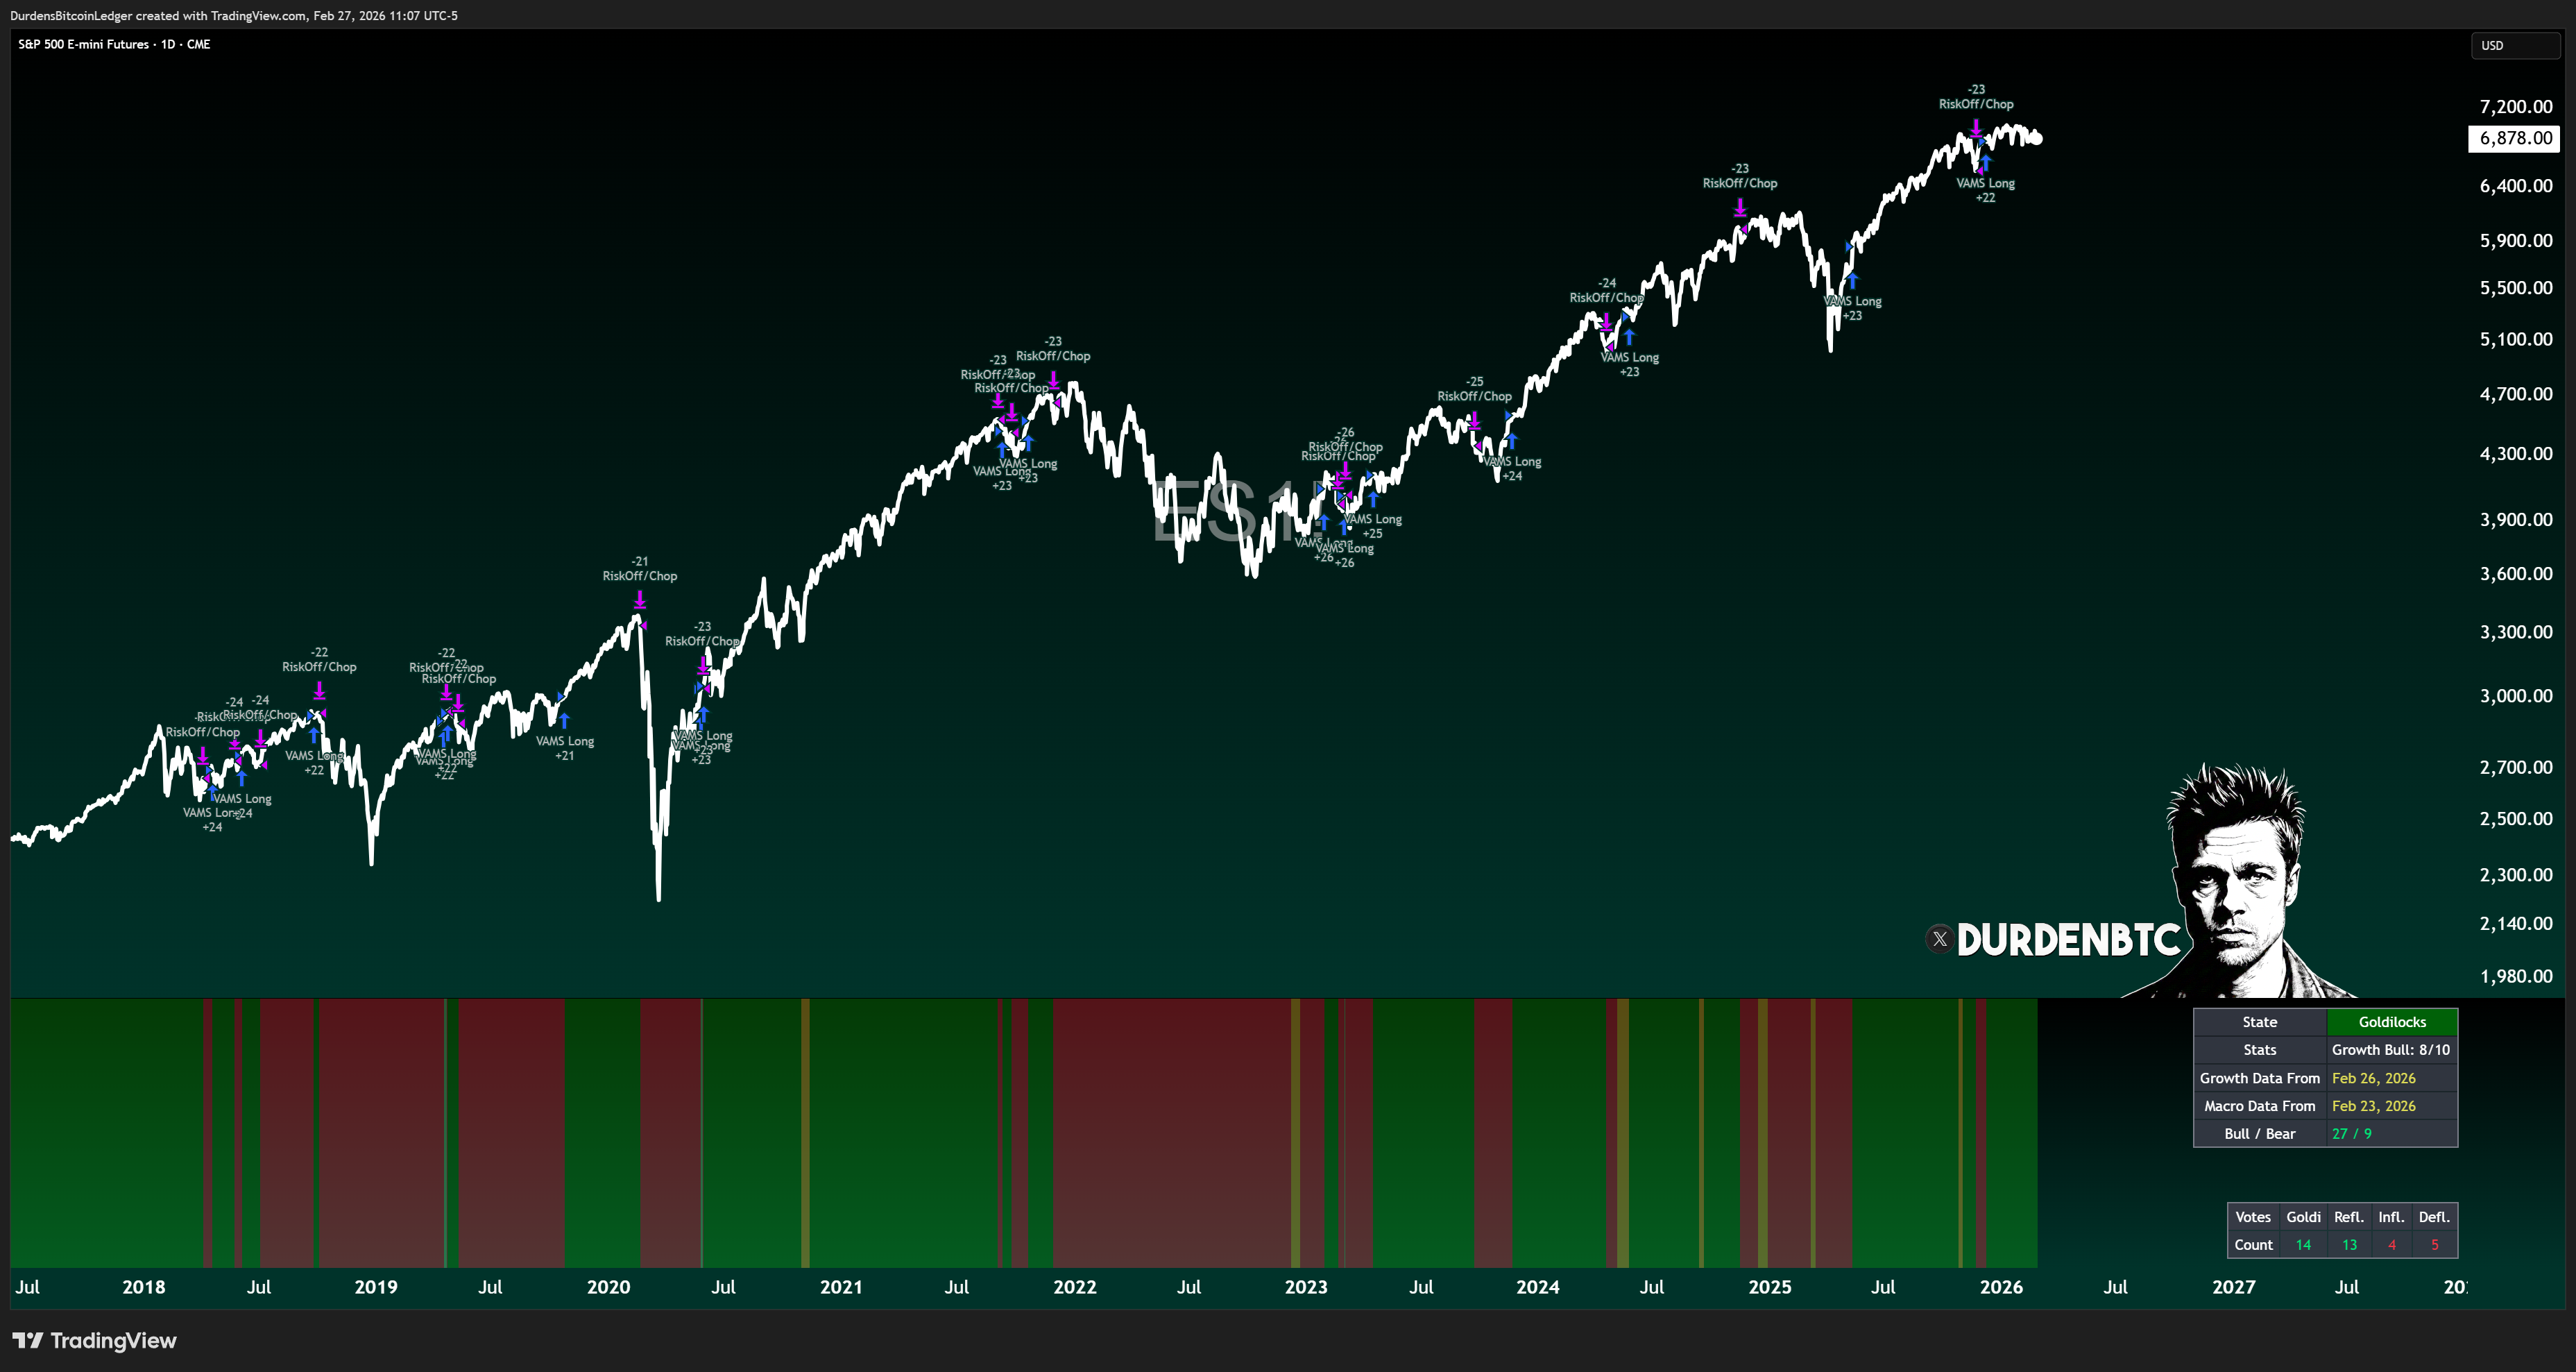
Macro Regime: Still Risk-On. Bullish votes dropped from 31 to 25 (vs. 9 bearish).. things are shifting under the hood, but not enough to flip the signal.
Bitcoin: Still bearish on both signals. The 10% Wednesday pump changed nothing. We’re only 22 days into this drawdown, expect at least another month before any bullish signals emerge.
Portfolio Changes: Added a global equities sleeve ($ACWX) based on the AI diffusion thesis. Closed the bull put spread pre-NVDA earnings for +70% profit, reopened with one fewer contract. Bitcoin allocation sitting in cash.
Stress Dashboard: VIX back above 20 (watch this). Dollar still bearish (good). SOFR-Fed Funds spread has come down (good). MOVE Index below 70 (good). Mixed but manageable.
New Charts: Released four valuation models: Harmonic Oscillator, Bitcoin Liquidity Fair Value, Global Liquidity Fair Value, and 200DMA Quantile Regression. All reading at historic capitulation levels.
TGA Narrative: Dead. The drawdown everyone was banking on for a liquidity injection never happened. TGA has stayed above $900B. Called it.
On the Radar: Kevin Warsh potentially getting confirmed as new Fed Chair in the coming months.. major liquidity implications.
The Signal: Still Risk-On (But Watch the Cracks)
The Macro Regime Engine is still firmly in risk-on territory. 25 bullish votes to 9 bearish.
But let’s be honest about what’s happening under the hood: we were at 31 bullish last week. That’s a meaningful drop. The signal hasn’t flipped, and we don’t act on directional drift.. we act on confirmed regime changes. But the erosion is worth noting.
Second, I closed the bull put spread right before NVIDIA earnings for approximately +70% profit. After the S&P dropped ~1% post-earnings, I reopened with one fewer contract. This is the scaling strategy I run during risk-on regimes.. max exposure early when conviction is highest, then gradually reduce as the regime matures. Five contracts last time, four this time, probably three next time.
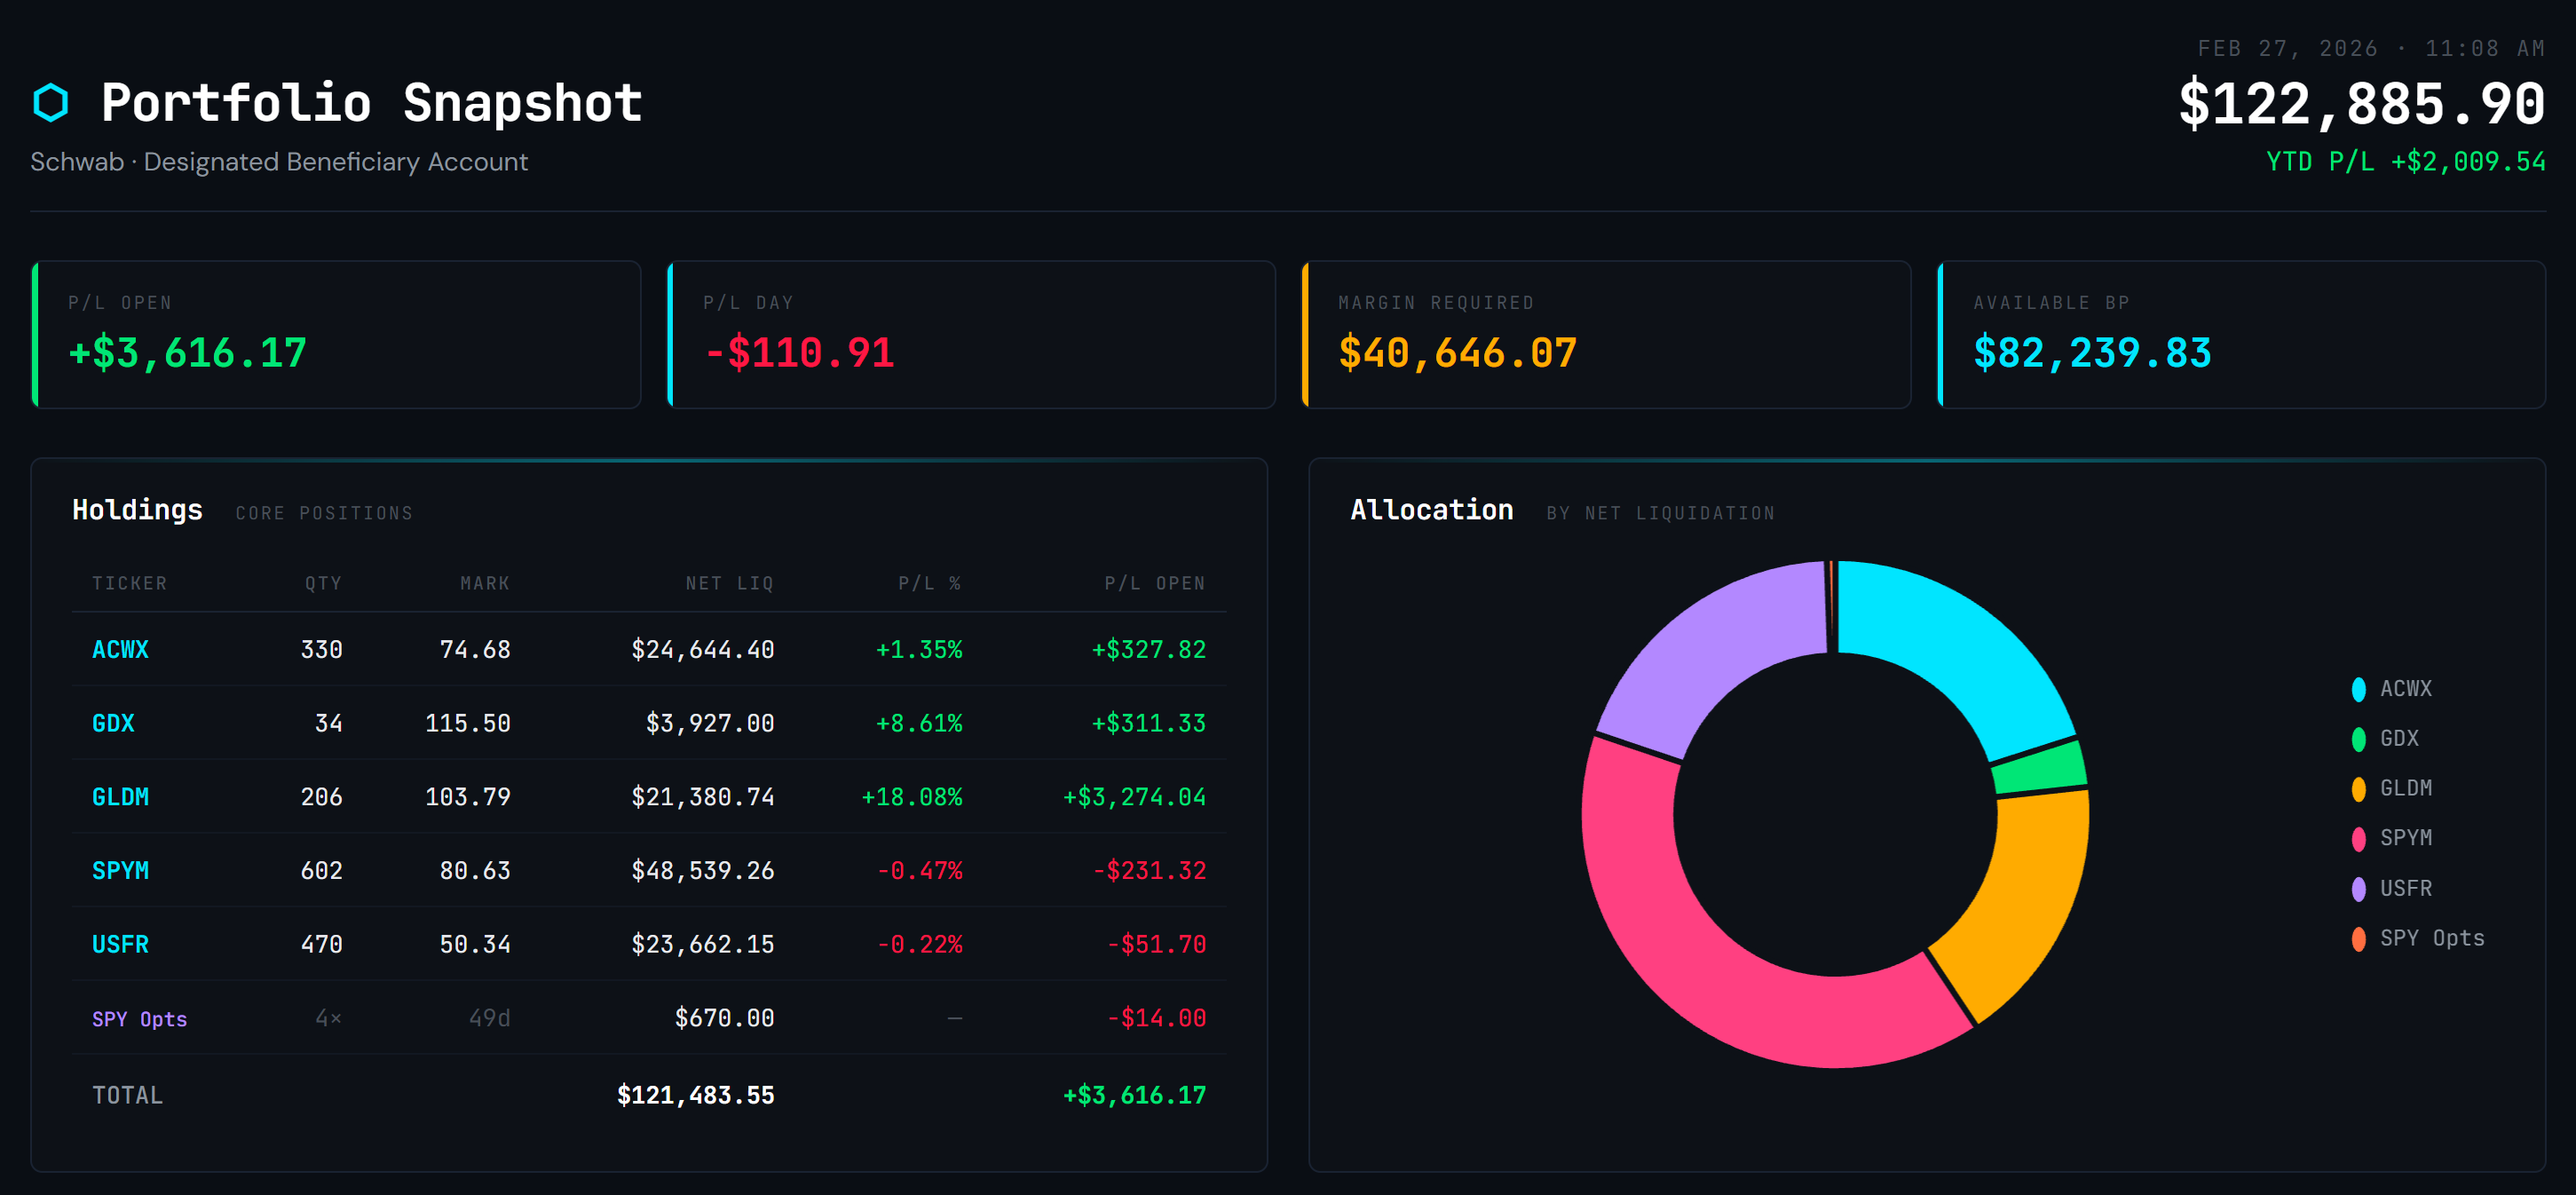
Current allocation: 40% SPY, 20% ACWX, 20% gold (plus a small gold miners sleeve), and 20% earmarked for Bitcoin but currently parked in cash because the system is bearish. Receipts always provided.
Bitcoin Trend: Bearish.. And That 10% Pump Was a Trap
Wednesday’s ~10% pump had the entire timeline in euphoria mode. “We’re so back.” Classic.
I checked the signal. Still red. Overwhelmingly red. No changes. Not chasing pumps. I am doing what my system tells me to do.
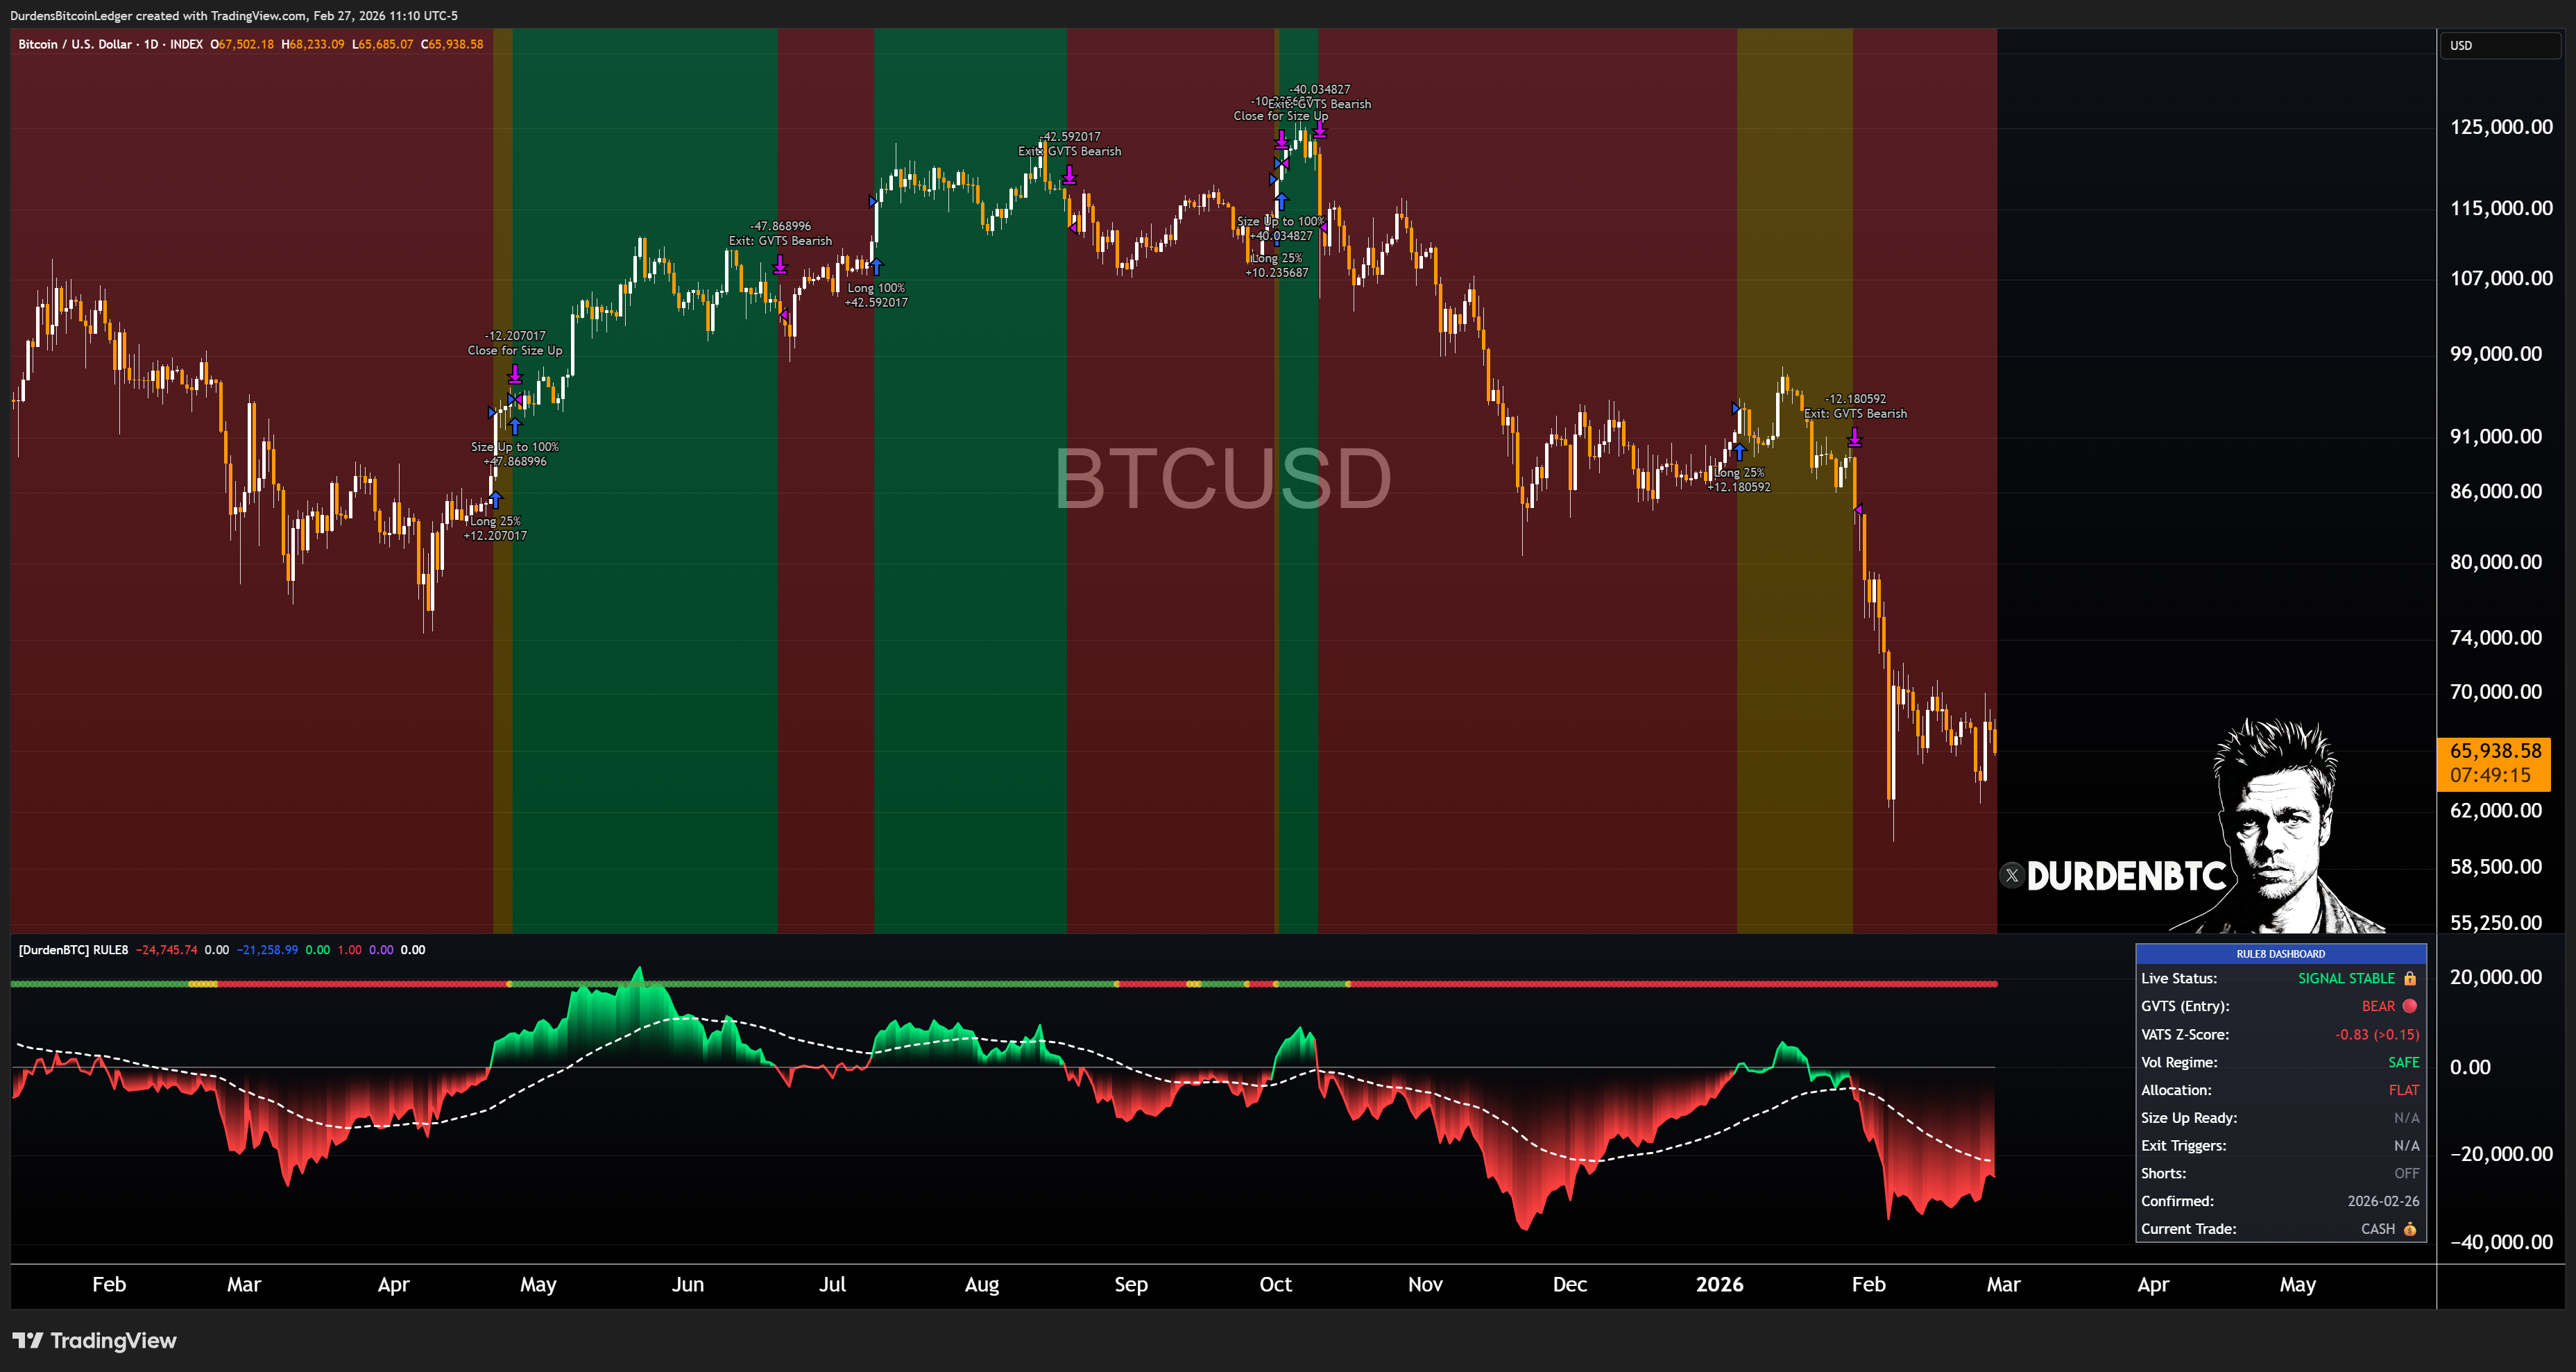
And sure enough, we retraced right back to ~$66K by Friday. This is the exact kind of move that destroys people who trade on emotion. They FOMO in at the top of a bear market rally, get trapped, and then panic sell the next leg down.
For context: the last major nuke took about a month and a half to digest. We’re only 22 days into this one. If I had to guess (banana to my head), I’d say probably another month before we see any legitimate bullish signals. But I don’t trade guesses, I trade the system.
On-Chain Data: Long-term holders have actually stopped buying, which is not what you want to see. Retail investors are sitting at roughly zero. Adjusted MVRV is still in the pits.. but it can go lower. I’m specifically waiting for a capitulation signal here. If that fires, I would actually consider going outside my system and purchasing some BTC for long-term cold storage. But we’re not there yet.
All momentum indicators on ChartInspect remain bearish. No alpha to glean from momentum right now.
The Charts: Four Models, One Message.. Historic Capitulation
This is the section I’ve been wanting to share. I spent this week building and refining four valuation models, and they’re all saying the same thing: we are at levels that have rarely — if ever — been seen in Bitcoin’s price history.
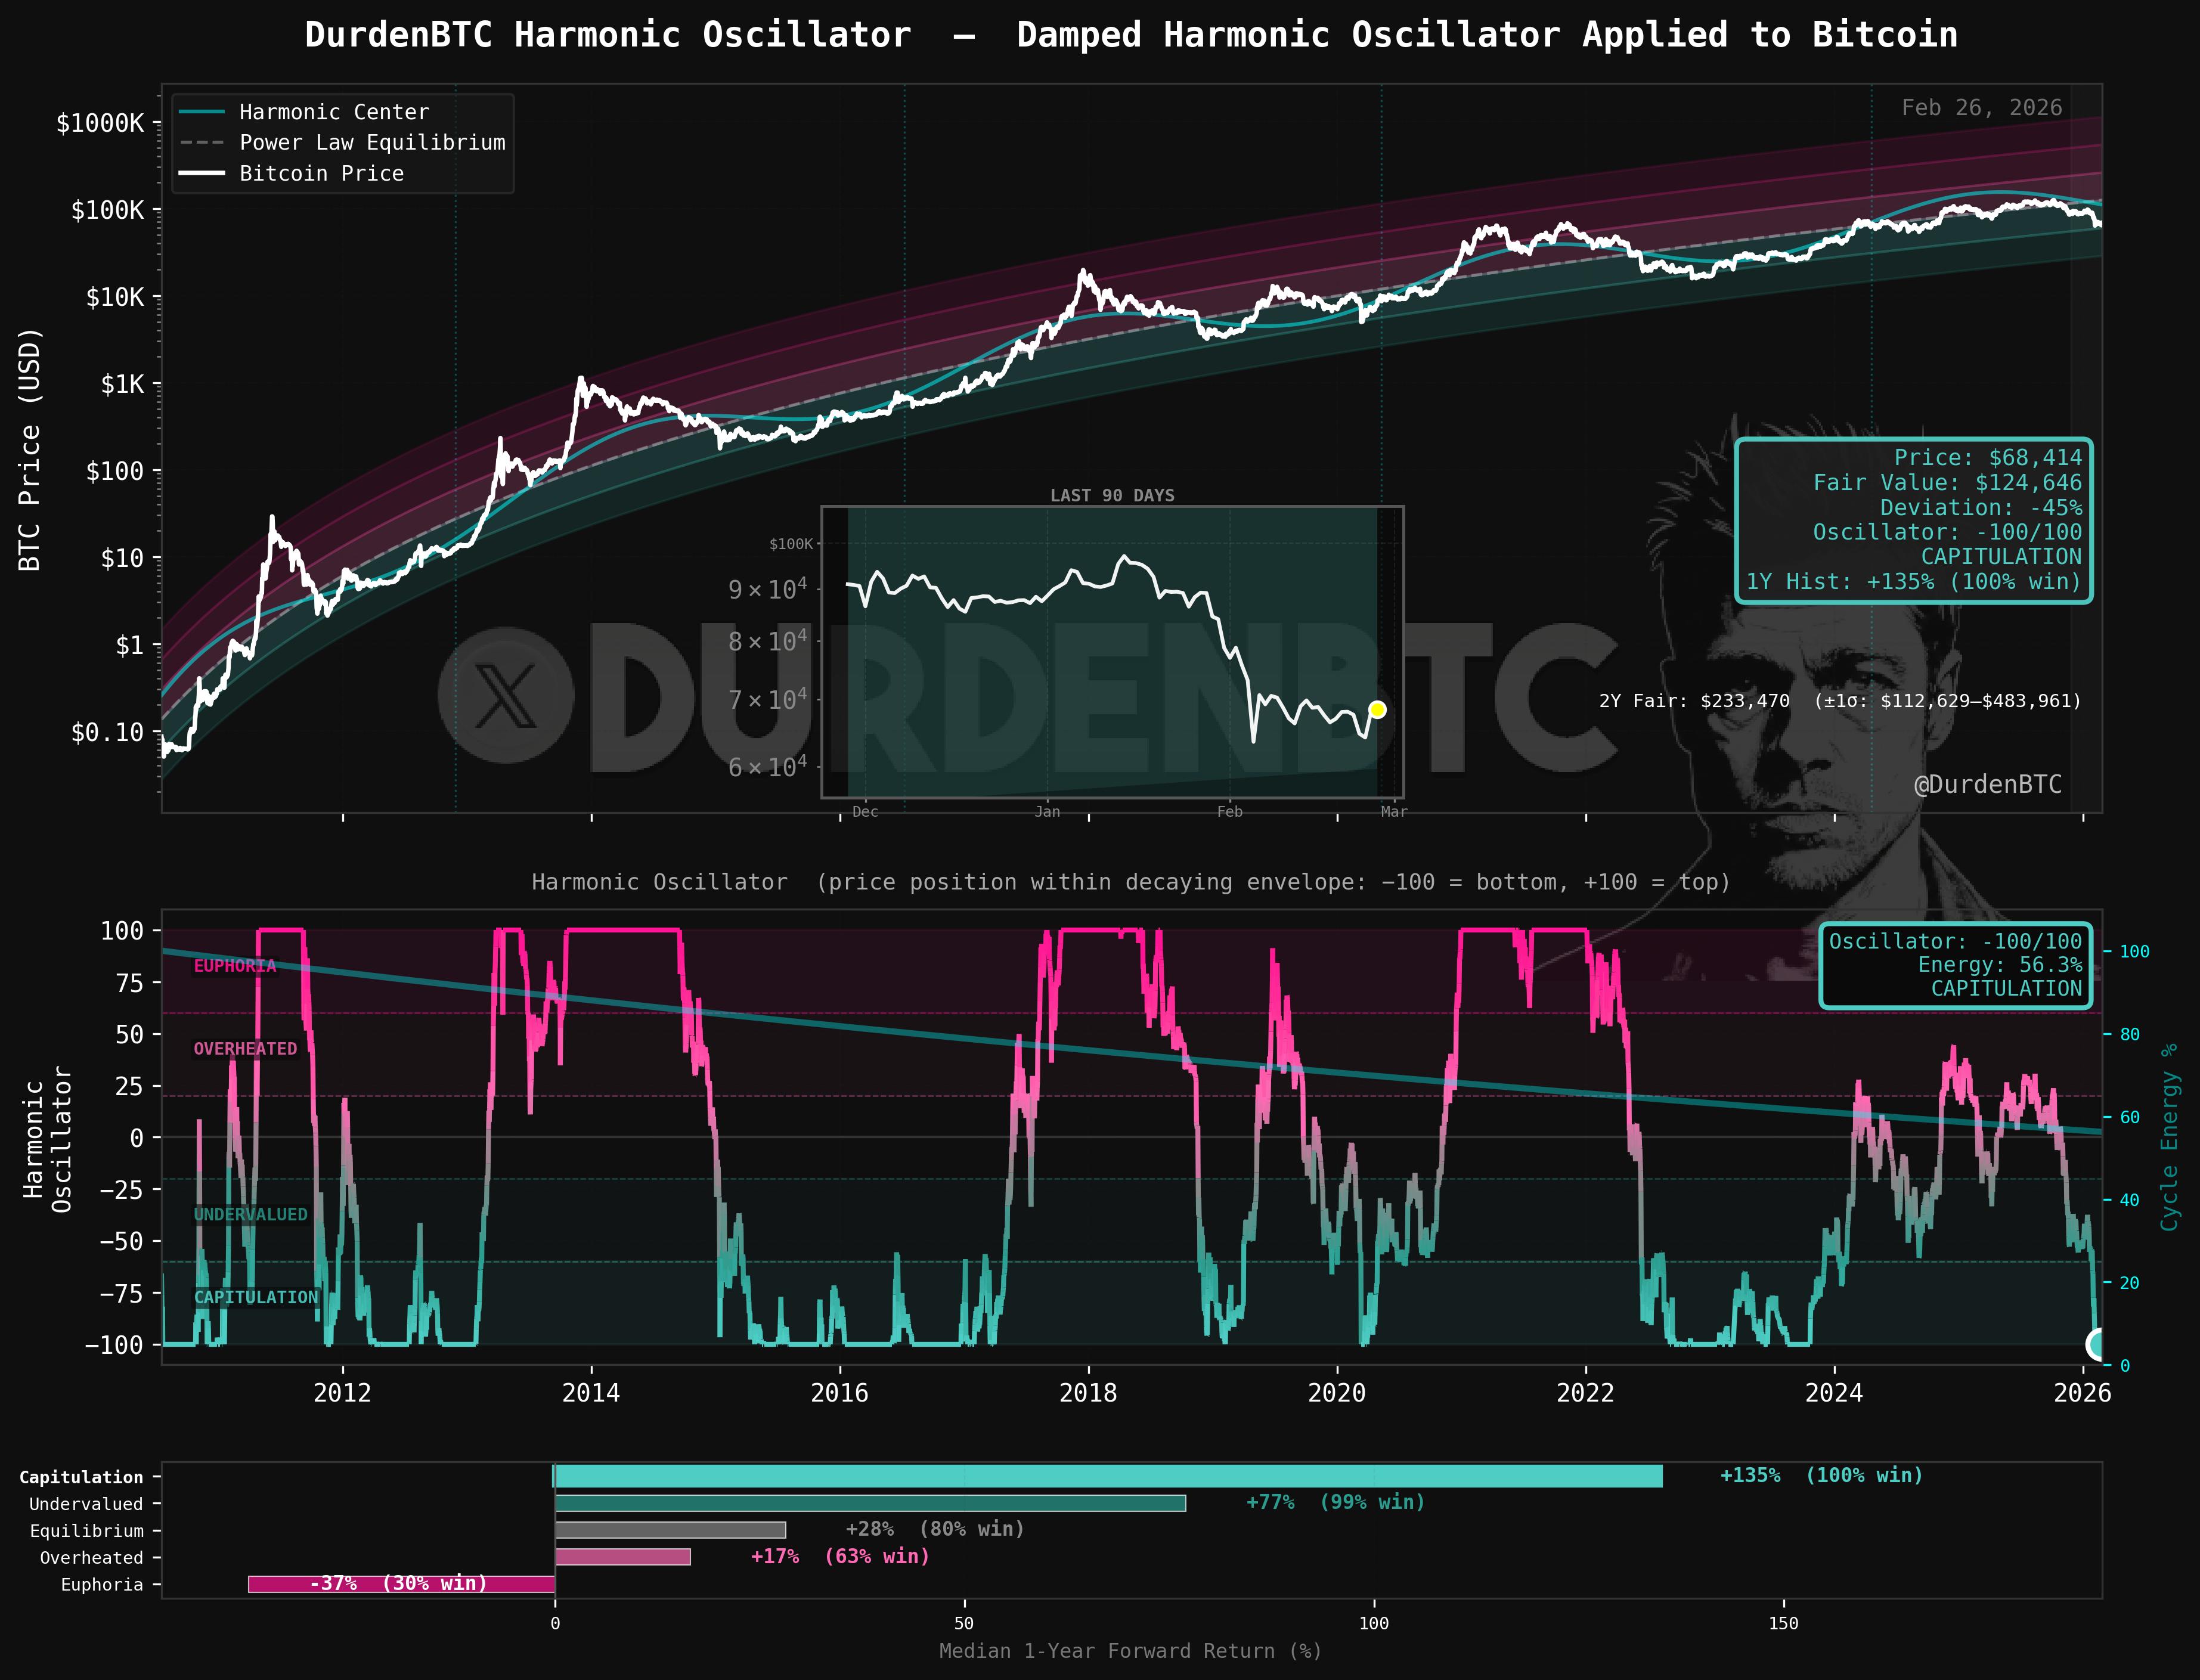
1. The Harmonic Oscillator
This is a play on the power law using the same physics formula applied to electrical circuits, pendulum springs, and oscillating systems. The oscillator is currently reading -100. Full capitulation.
But.. and this is important, you can see from the chart that Bitcoin can sit in this zone for almost a year, if not longer. Being oversold doesn’t mean “buy now.” It means the conditions for a major move are building. Timing still matters.
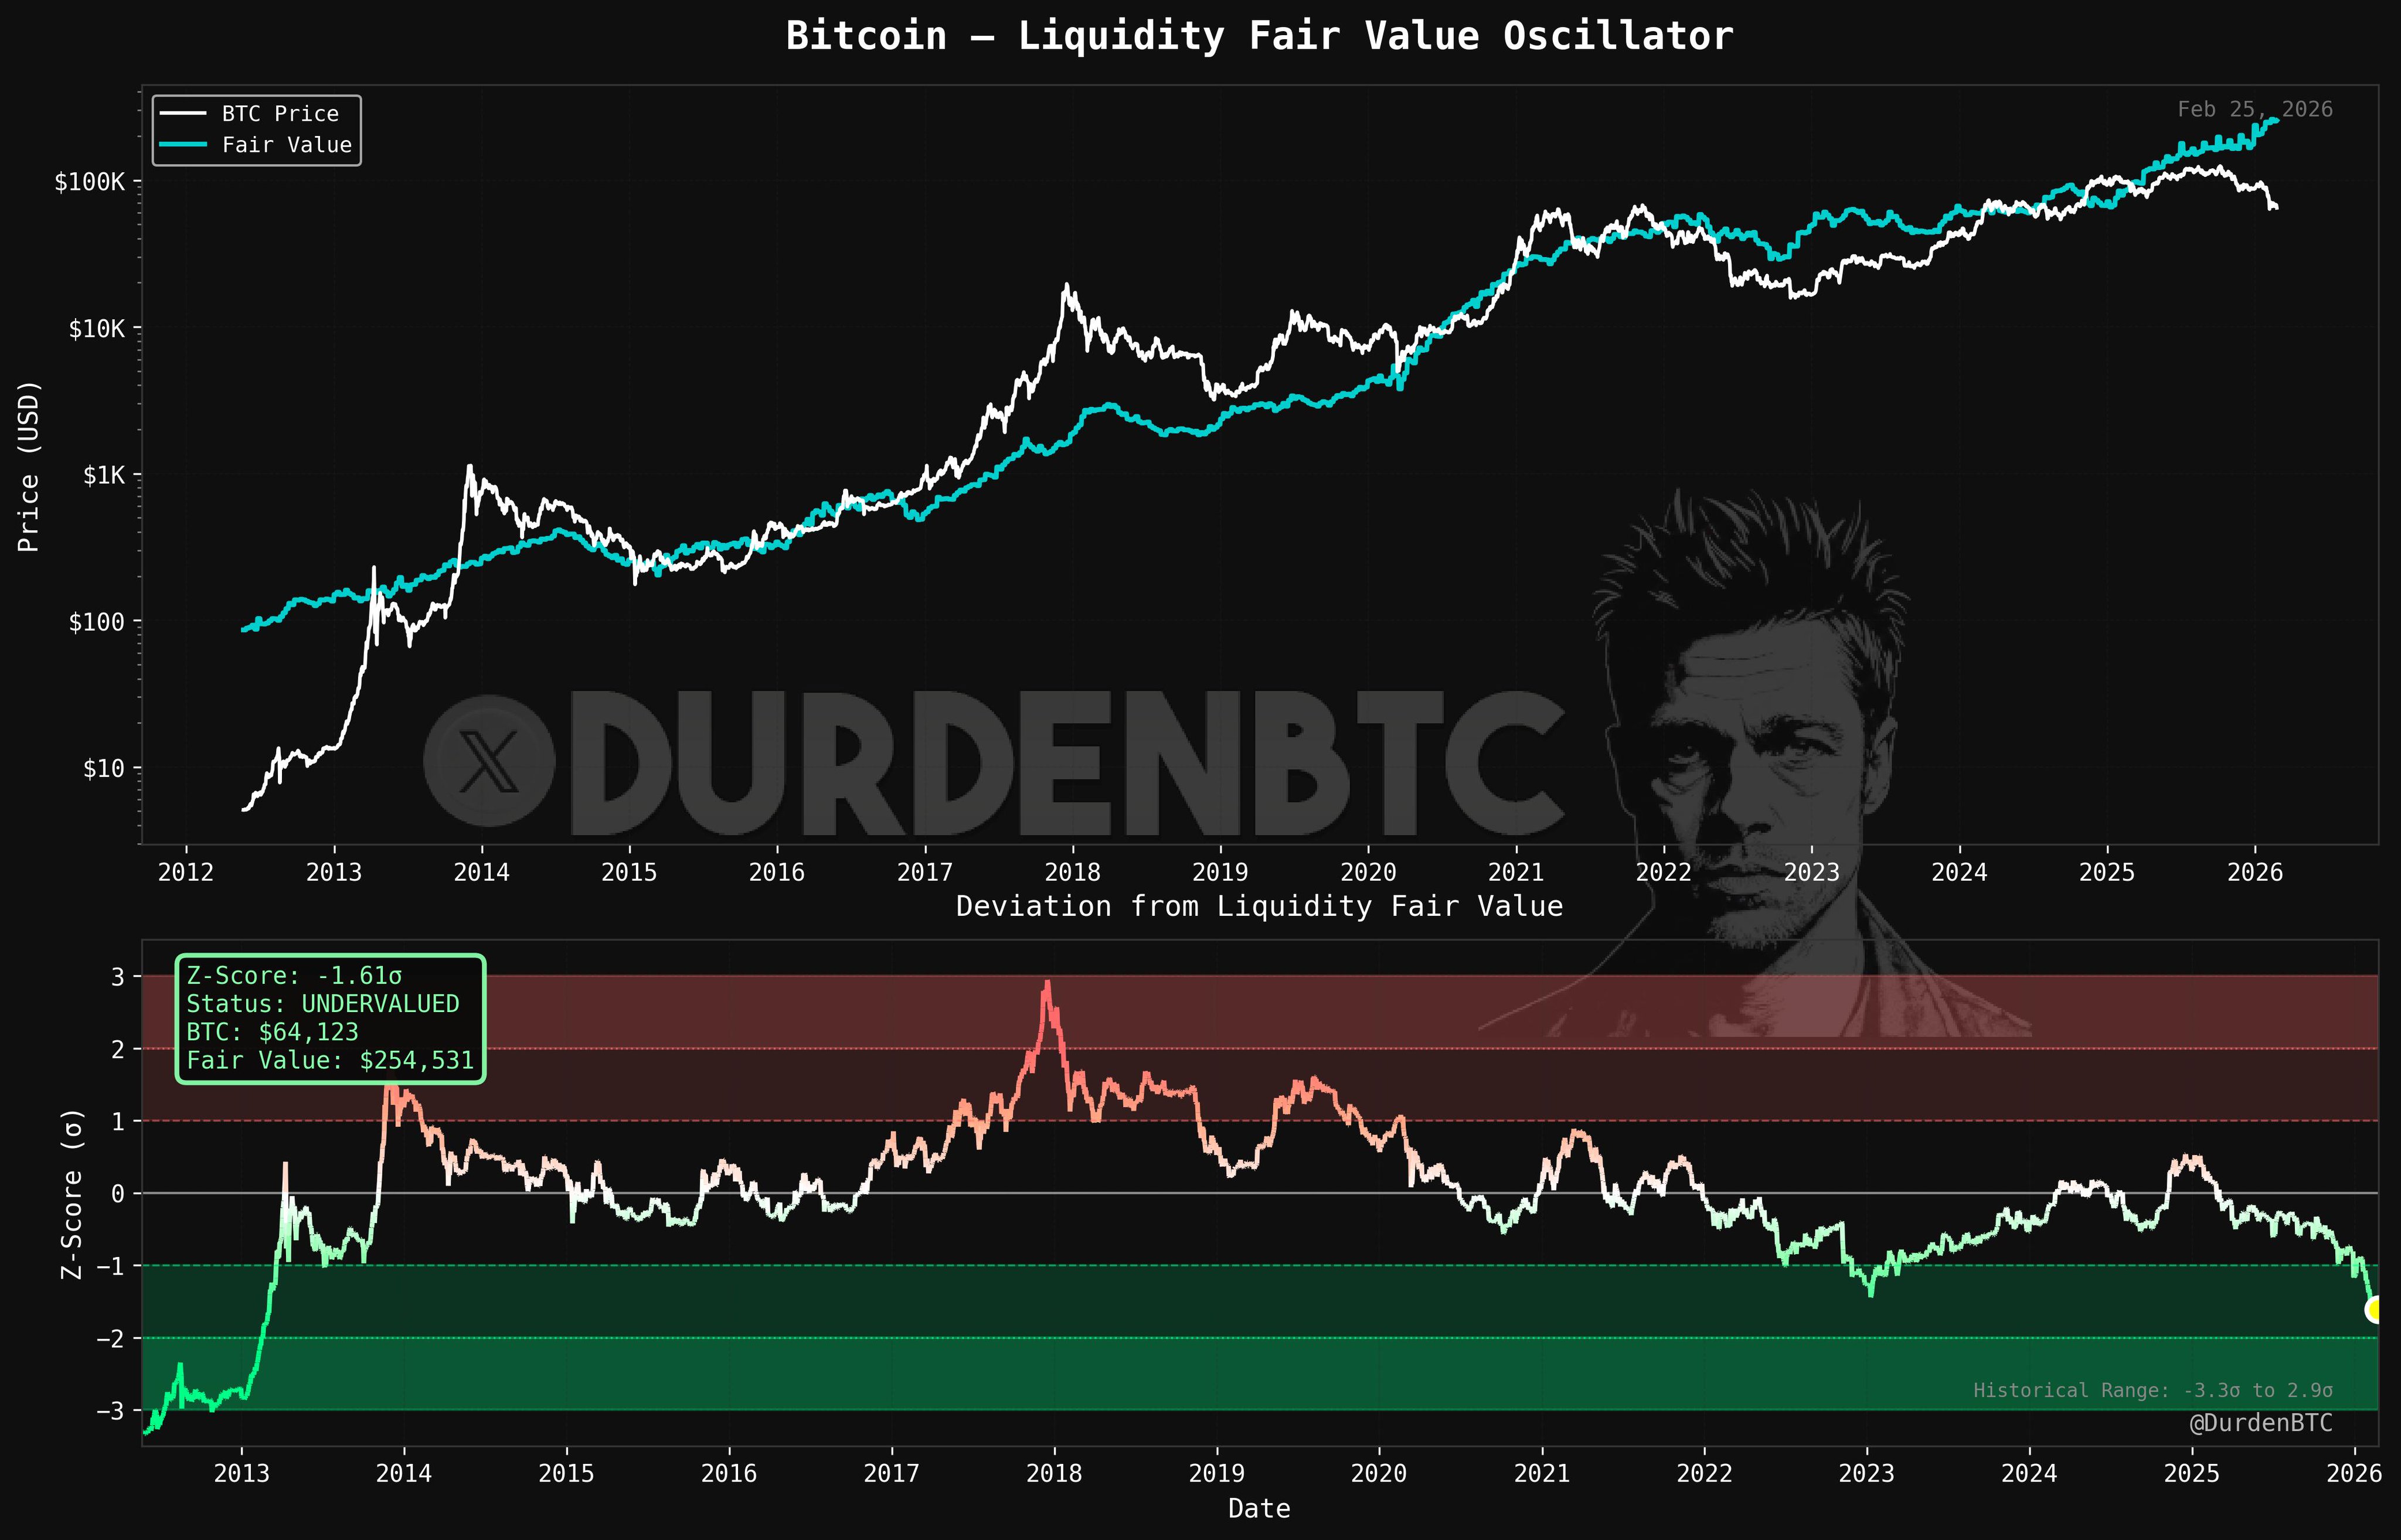
2. Bitcoin Liquidity Fair Value Oscillator
This one measures Bitcoin’s price relative to liquidity conditions. The current reading is the lowest since 2013. And I’d argue anything before 2014 was a fundamentally different asset class.. too immature to be comparable. So this is effectively the lowest meaningful reading in Bitcoin’s history.
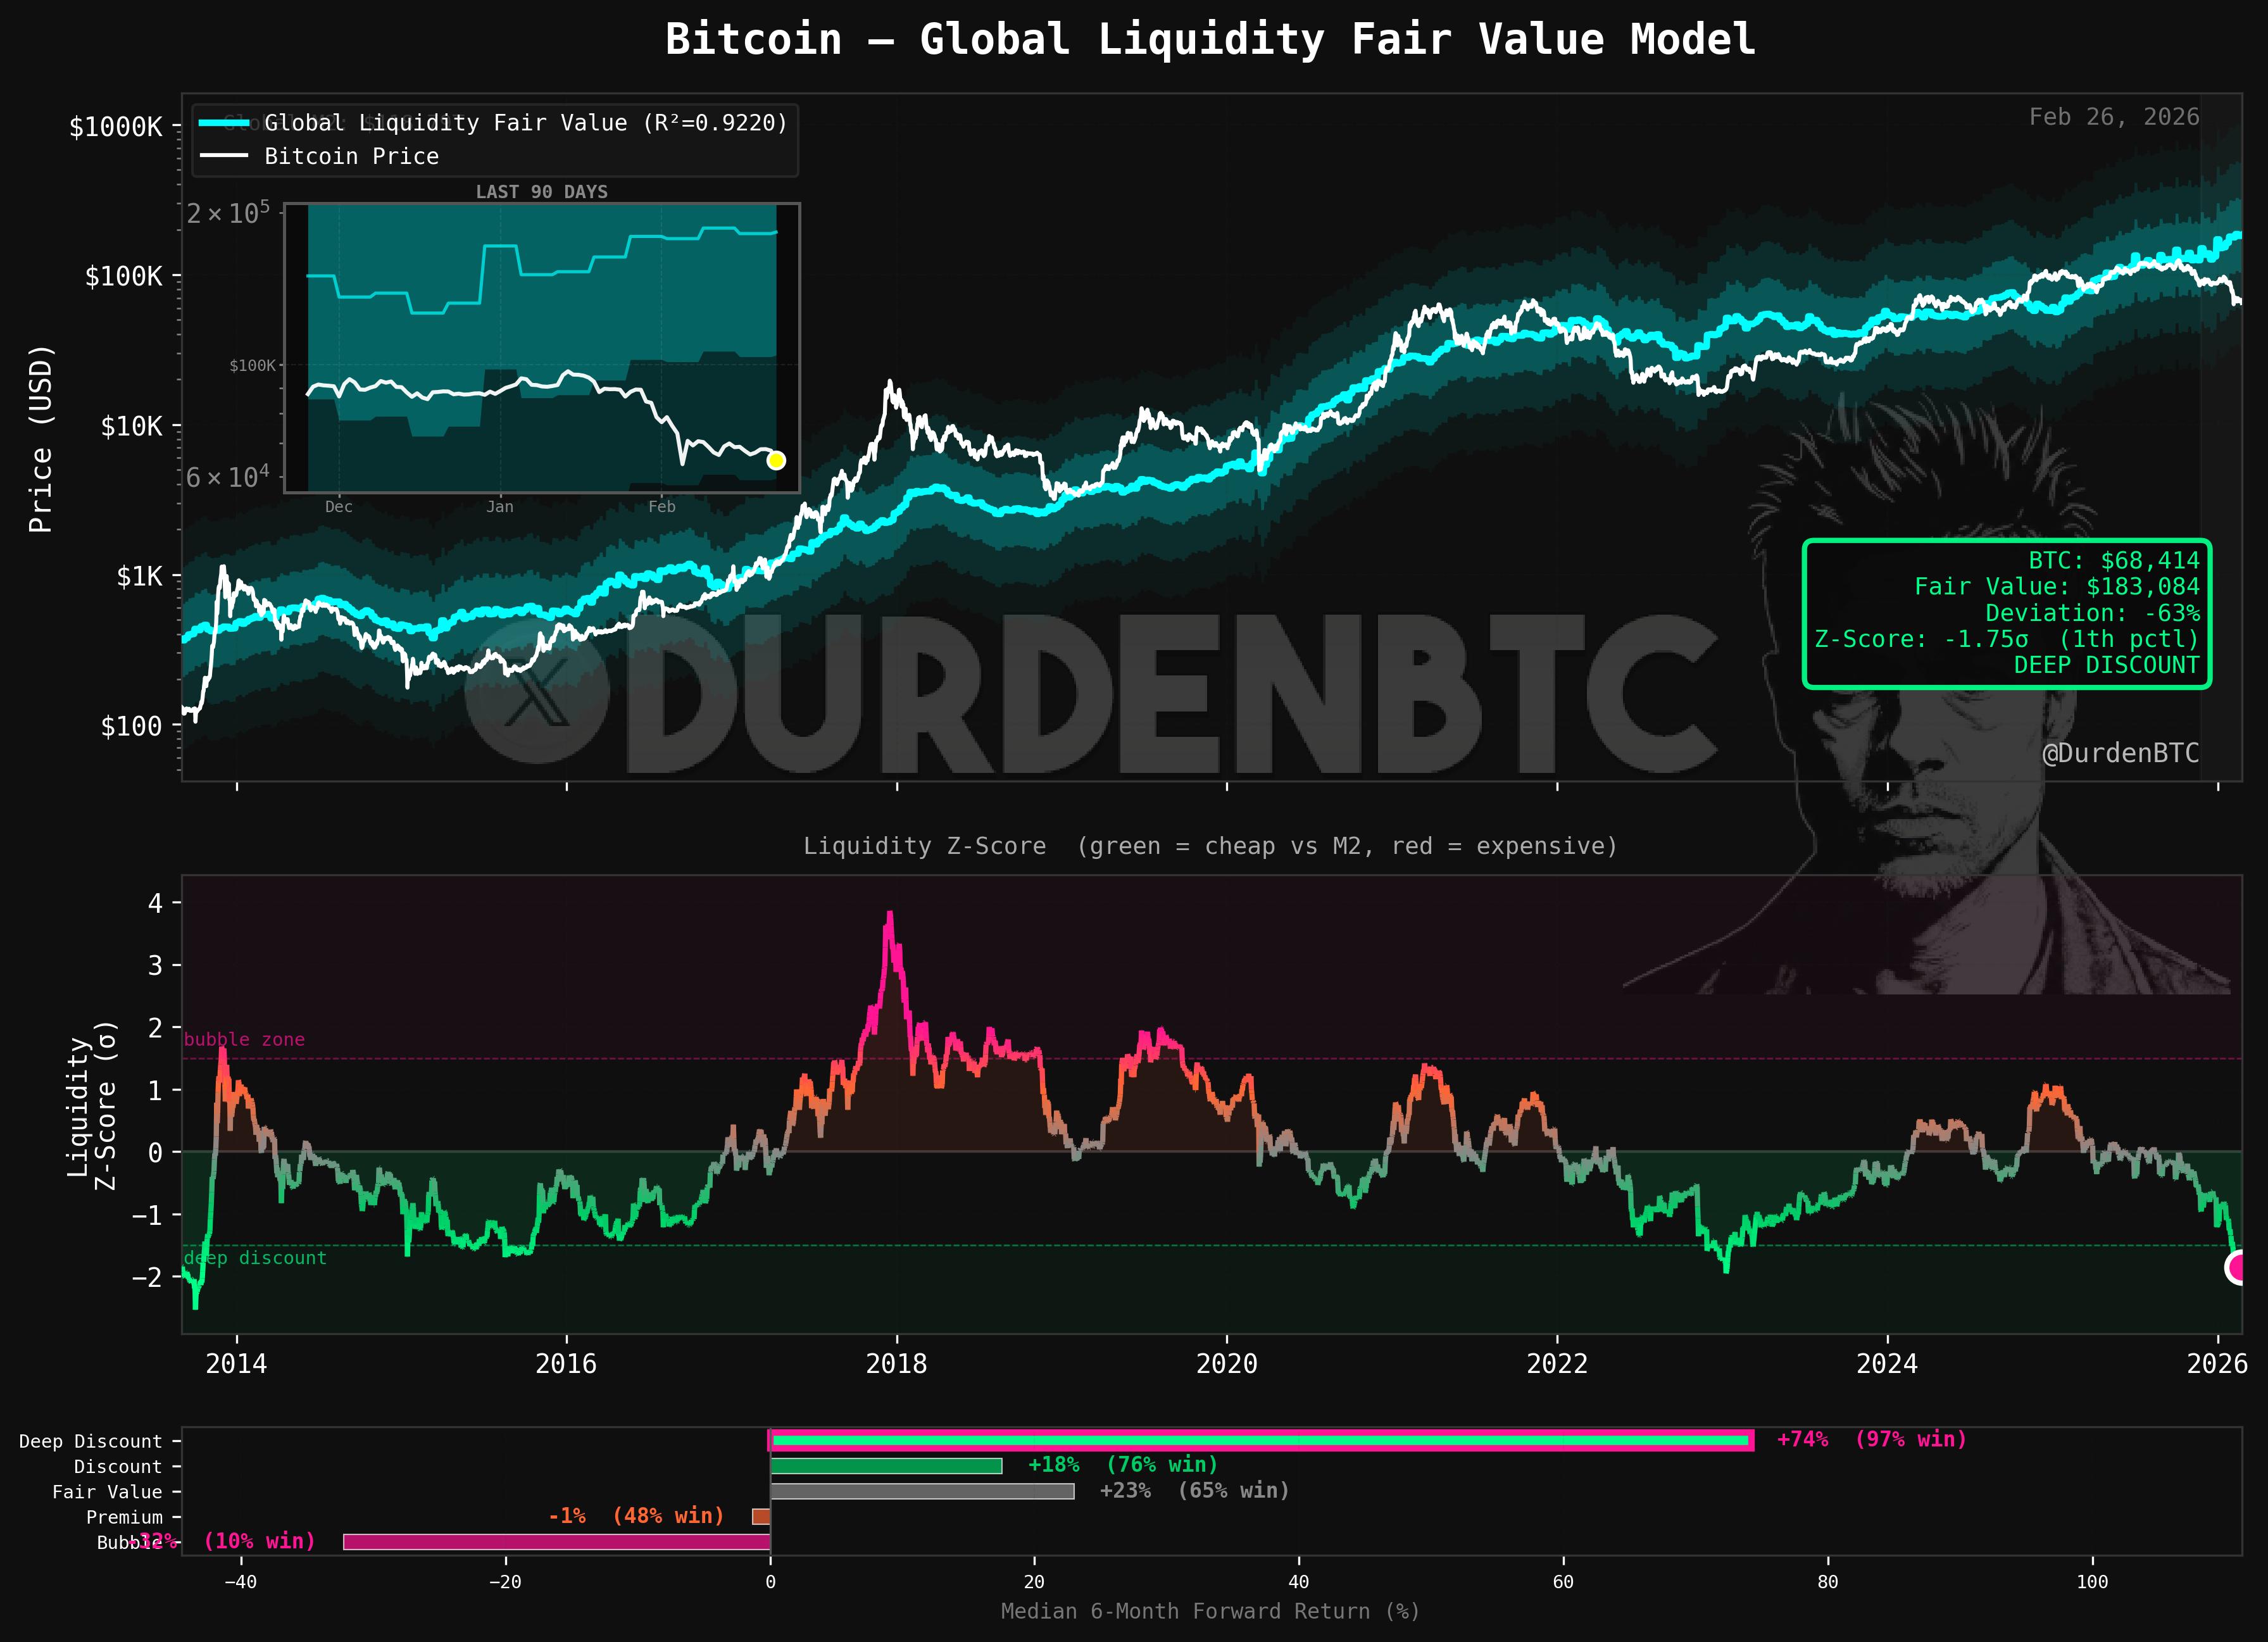
3. Global Liquidity Fair Value Model
Same story, broader lens. This model looks at Bitcoin relative to global liquidity conditions. Current reading: 1st percentile. Numbers we have not seen in almost the entire history of Bitcoin’s price existence.
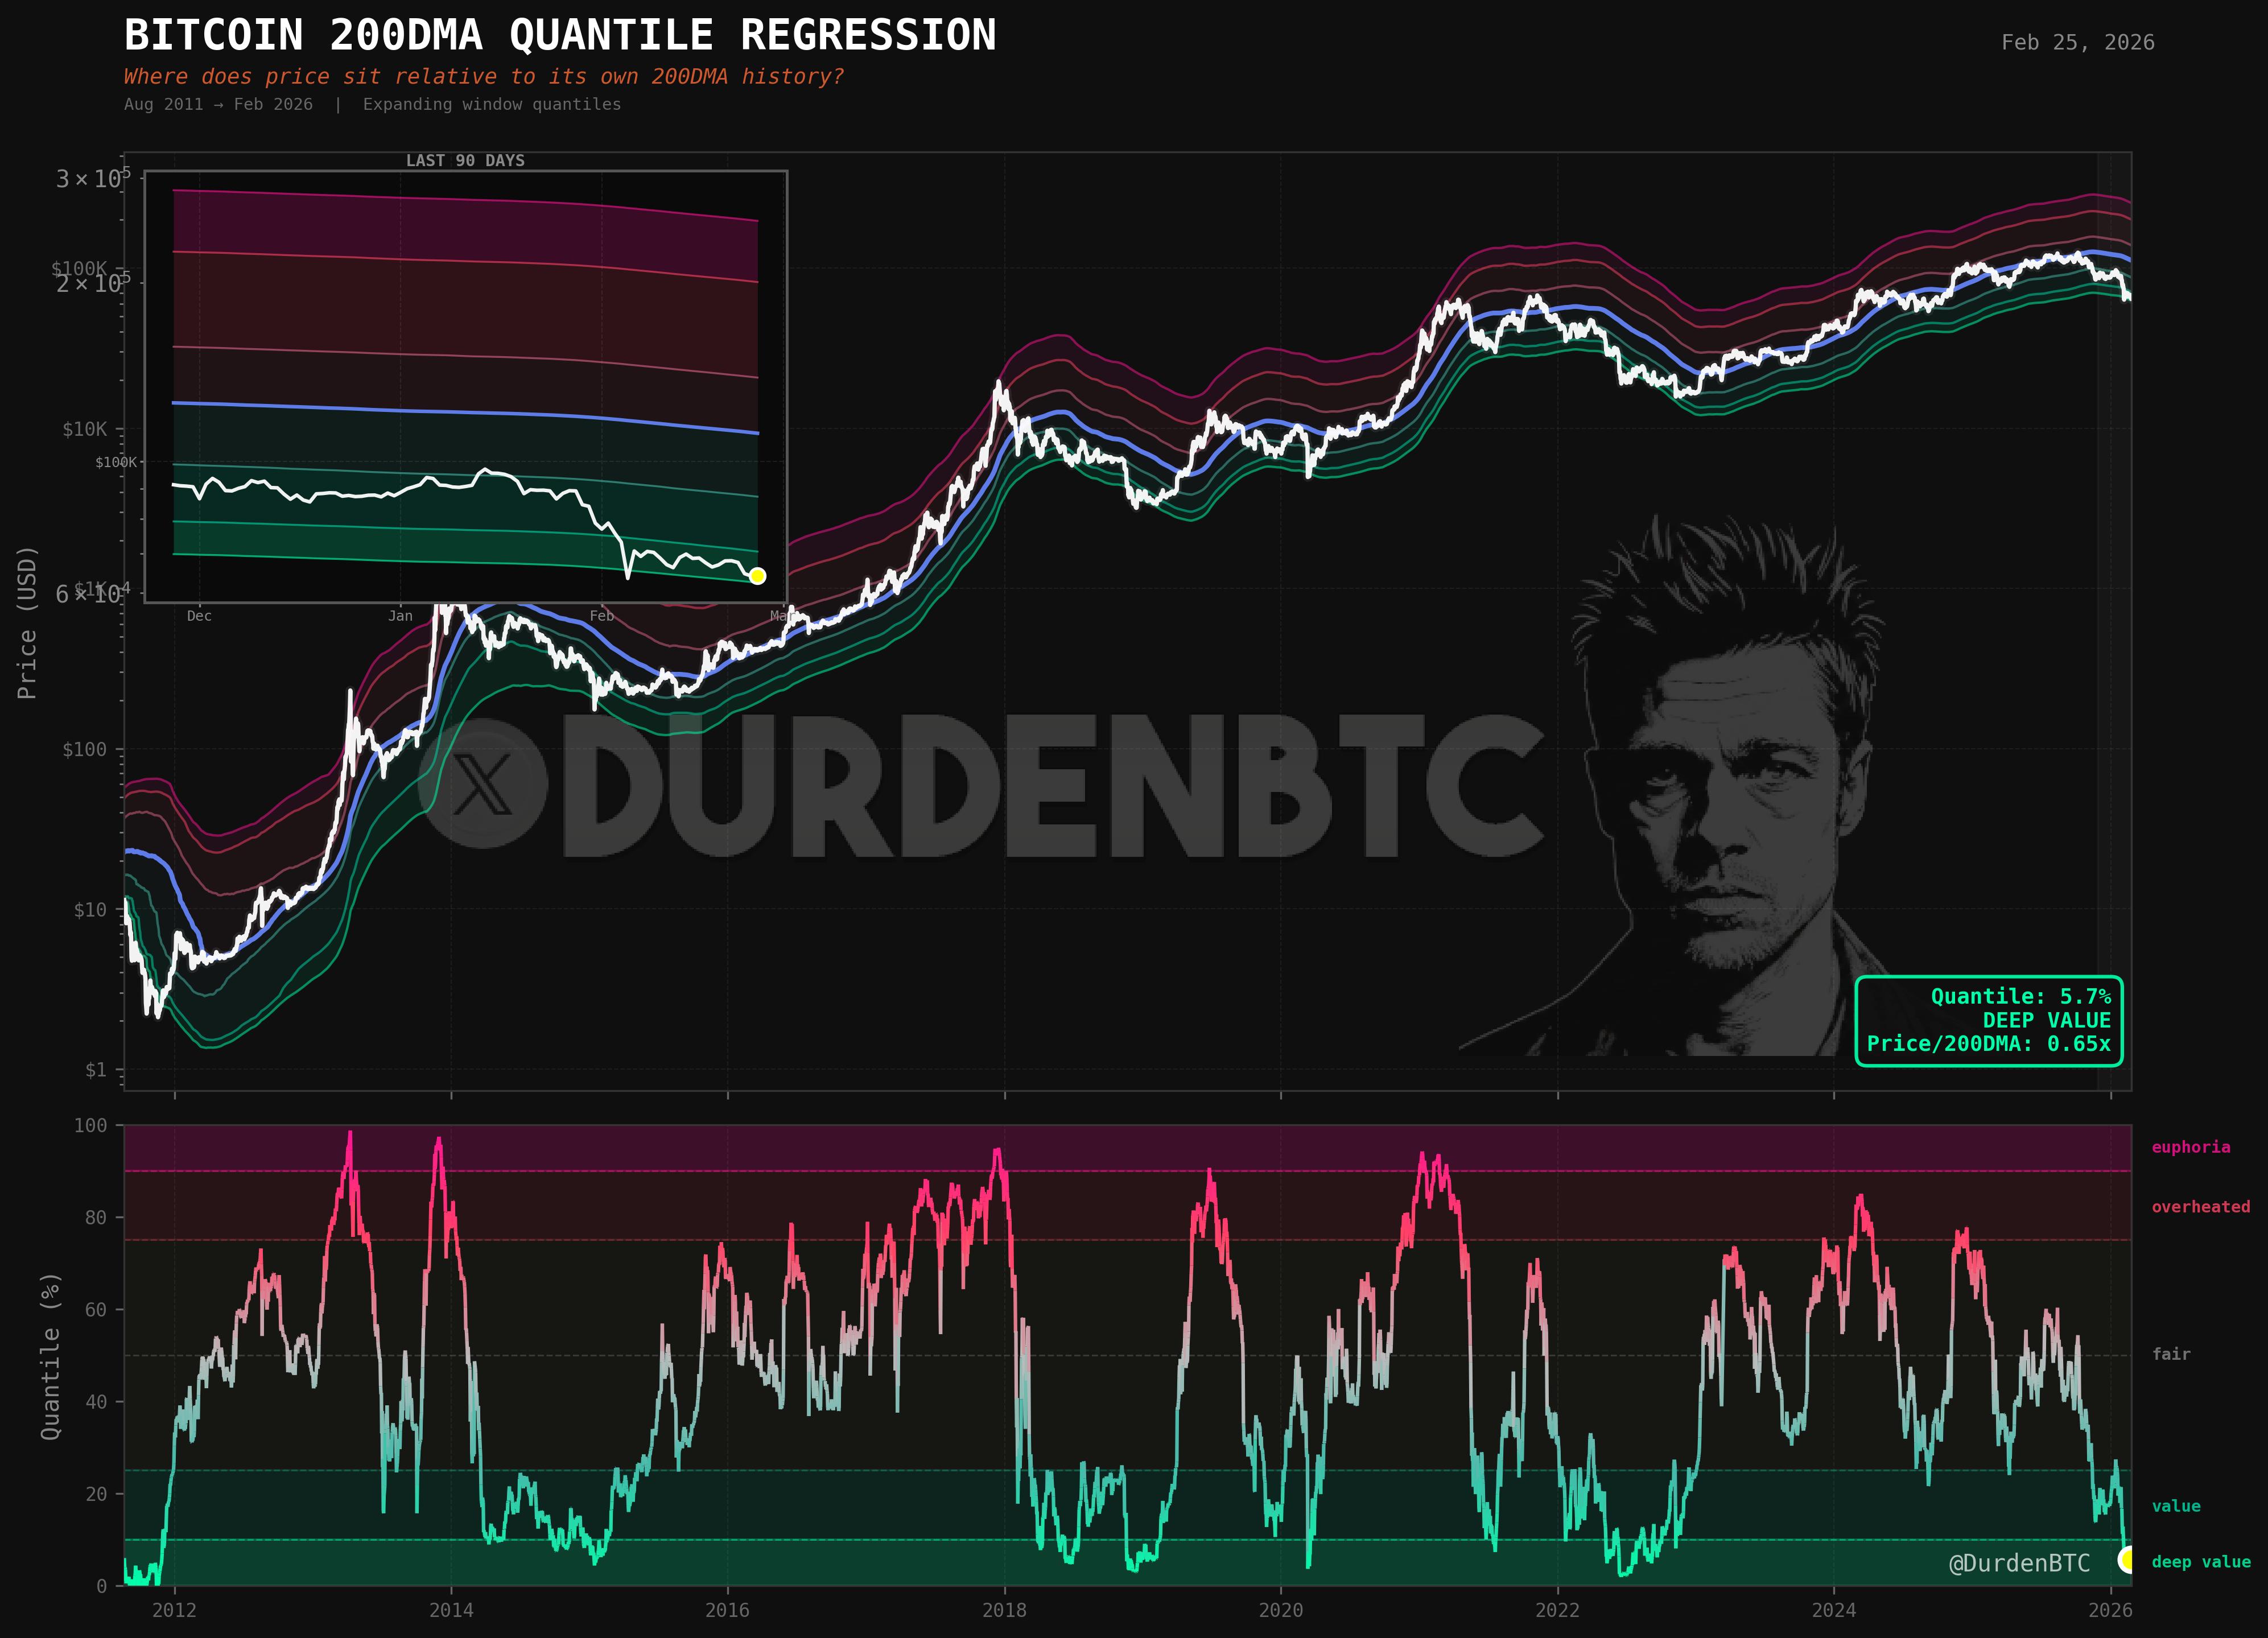
4. 200-Day Moving Average Quantile Regression
This is the simplest of the four, but arguably the most striking. Bitcoin actually briefly traded below the bottom band of the quantile regression.. something that, by the chart’s history, almost never happens. I may need to add another deviation band below this if the model continues to break. But the oscillator is clearly in deep value territory.
The message across all four: we are at generational valuation levels. If you’re a DCA long-term investor with a 5-10 year horizon, these are objectively good prices to be accumulating Bitcoin. But that’s not how I run my portfolio. The system is bearish, so the Bitcoin allocation stays in cash until it isn’t.
Macro Data & the TGA Myth
Quick data rundown: PPI and Core PPI both came in higher than forecast. Unemployment claims came in lower. Net effect on Fed policy: basically nothing. Rate cut odds for March actually dropped further. No cut is the current baseline.
Next week we get PMI (forecast 51.9, prior 52.6). As long as it stays above 50, we’re in expansion territory. That’s the key number to watch.
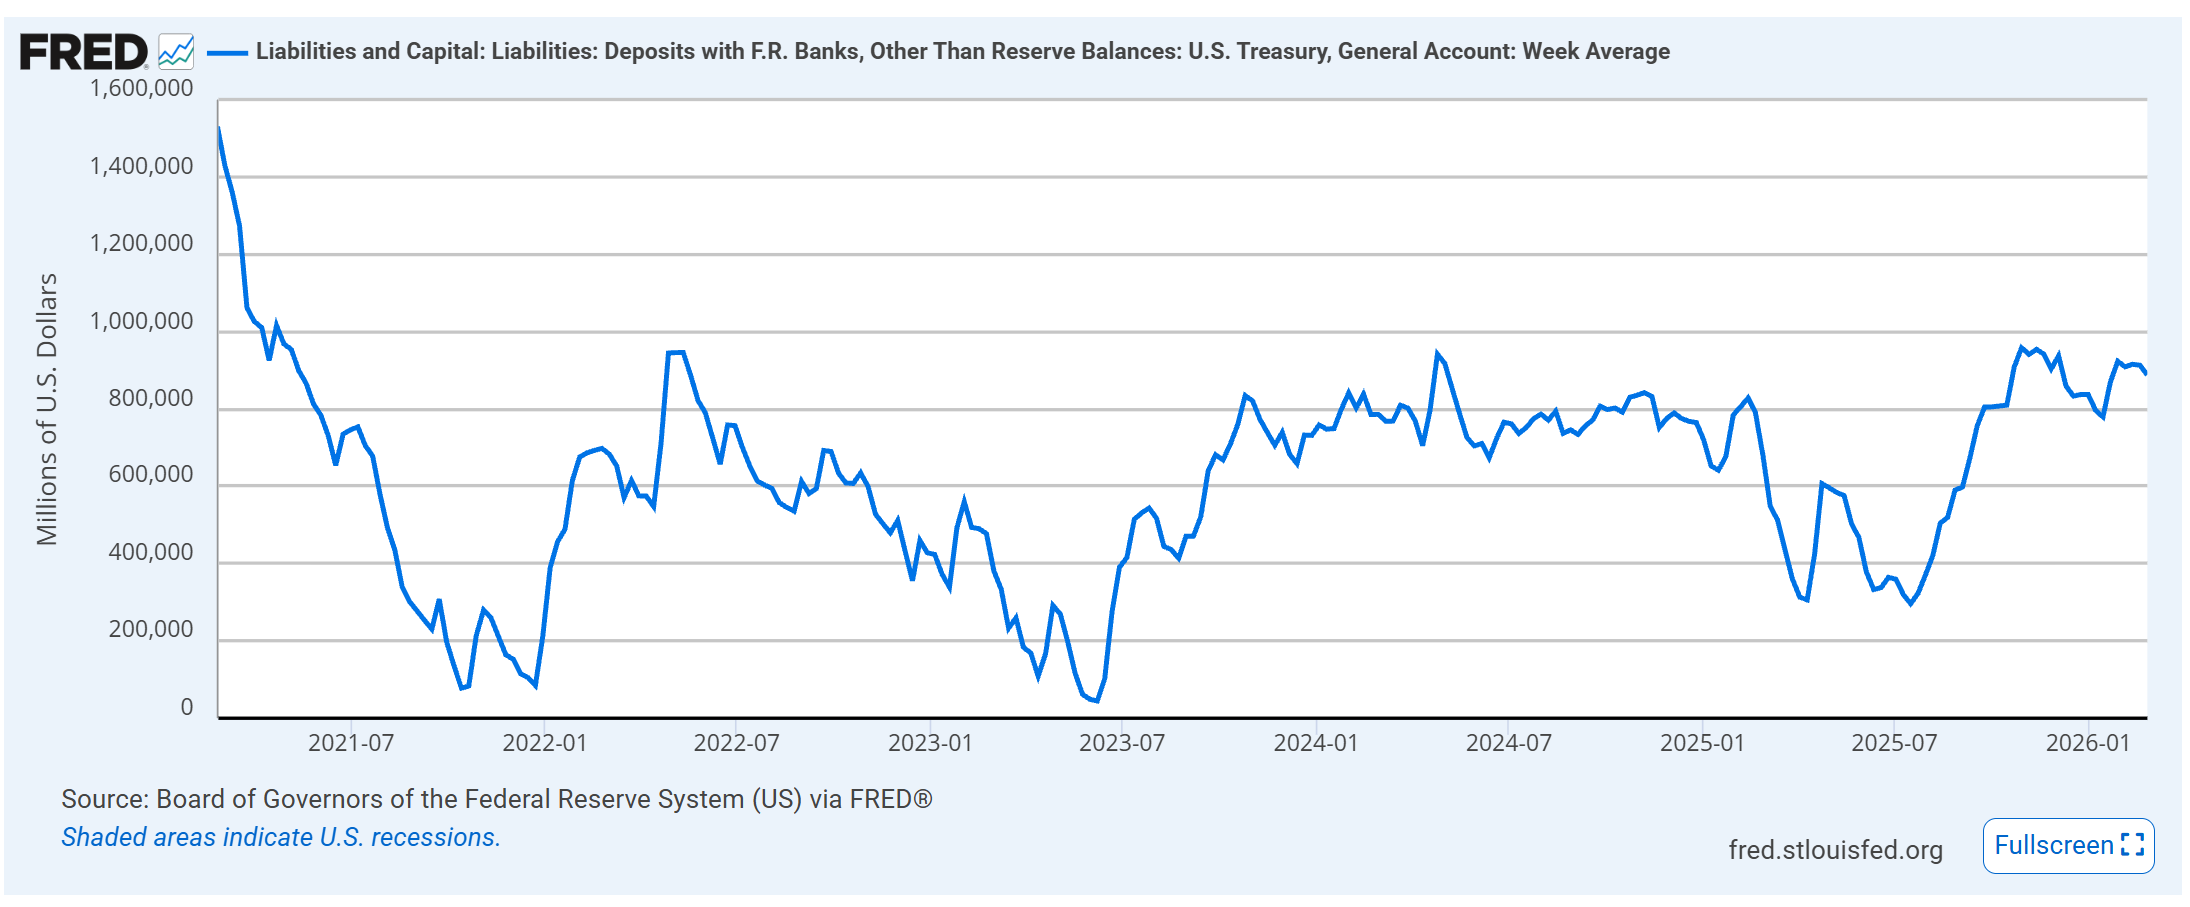
The TGA: Remember when everyone in November, December, and early January was harping about the Treasury General Account being drawn down to inject liquidity? I said at the time there was a floor around $800B because Treasury needs that balance to service ongoing obligations.
Well, lo and behold.. the TGA has stayed above $900B. No drawdown. No liquidity injection. The narrative was wrong. We follow systems, not narratives.
Kevin Warsh: One thing to keep on the radar.. Kevin Warsh is potentially getting confirmed as the new Fed Chair in the coming months. How that plays out for liquidity is anyone’s guess at this point, but it’s a variable worth tracking.
Final Thoughts
Four different valuation models. Four historic readings. All showing “generational opportunity.” And I’m sitting in cash on my Bitcoin allocation.
That’s the hardest part of systematic investing. It’s not the math. It’s the discipline to look at data that’s begging you to buy and still say “not yet” because the trend hasn’t confirmed. The emotional pull to front-run the signal is real.. especially when every chart you’ve built is flashing green on valuation while the trend is still flashing red.
But this is exactly why the system exists. To make the decision for me when I can’t trust myself to make it. The Harmonic Oscillator can sit at -100 for a year. The liquidity models can stay in the 1st percentile for months. Being oversold is not a timing signal.. it’s a context signal.
When the trend flips, we’ll be there. Until then, we wait.
Access my free indicator here: Dual Signal Trend Sentinel & consider subscribing for access to The 8th Rule.
For this week’s full video breakdown:
⚔️ Stay Sharp
Follow the Macro War Room every Friday for the only Bitcoin analysis that treats markets like the battlefield they are.
💥 Stay sovereign. Don’t be exit liquidity.
— Durden out.
✊🧼
Want the live dashboards behind these insights?
Subscribe on Substack Free subscribers get research updates. Paid subscribers get live macro tools + signal alerts.