Everyone wants the magic indicator that triples their money. I know, because I spent years hunting for it. Eventually I realized that’s a dead end; markets are just probabilities, and the only real edge is tilting those probabilities in your favor.
I switched to just wanting one indicator that stopped lighting my portfolio on fire every time the macro gods felt displeased with us mortals making too many positive returns.
Over the last few weeks I’ve spent countless hours in the lab (aka my home office) working through iteration after iteration of a tool I could use as a ‘guiding light’ for my portfolio. I’ve spent so many hours staring at the Pine Editor in TradingView my eyes are starting to dampen; not to mention the countless bags of coffee I’ve ripped through.
“Nothing in the world is worth having or worth doing unless it means effort, pain, difficulty… I have never in my life envied a human being who led an easy life. I have envied a great many people who led difficult lives and led them well.”
- Theodore Roosevelt
Those countless hours eventually paid off with actual clarity, a better understanding of what macro forces actually drive asset markets and most importantly… an idea.
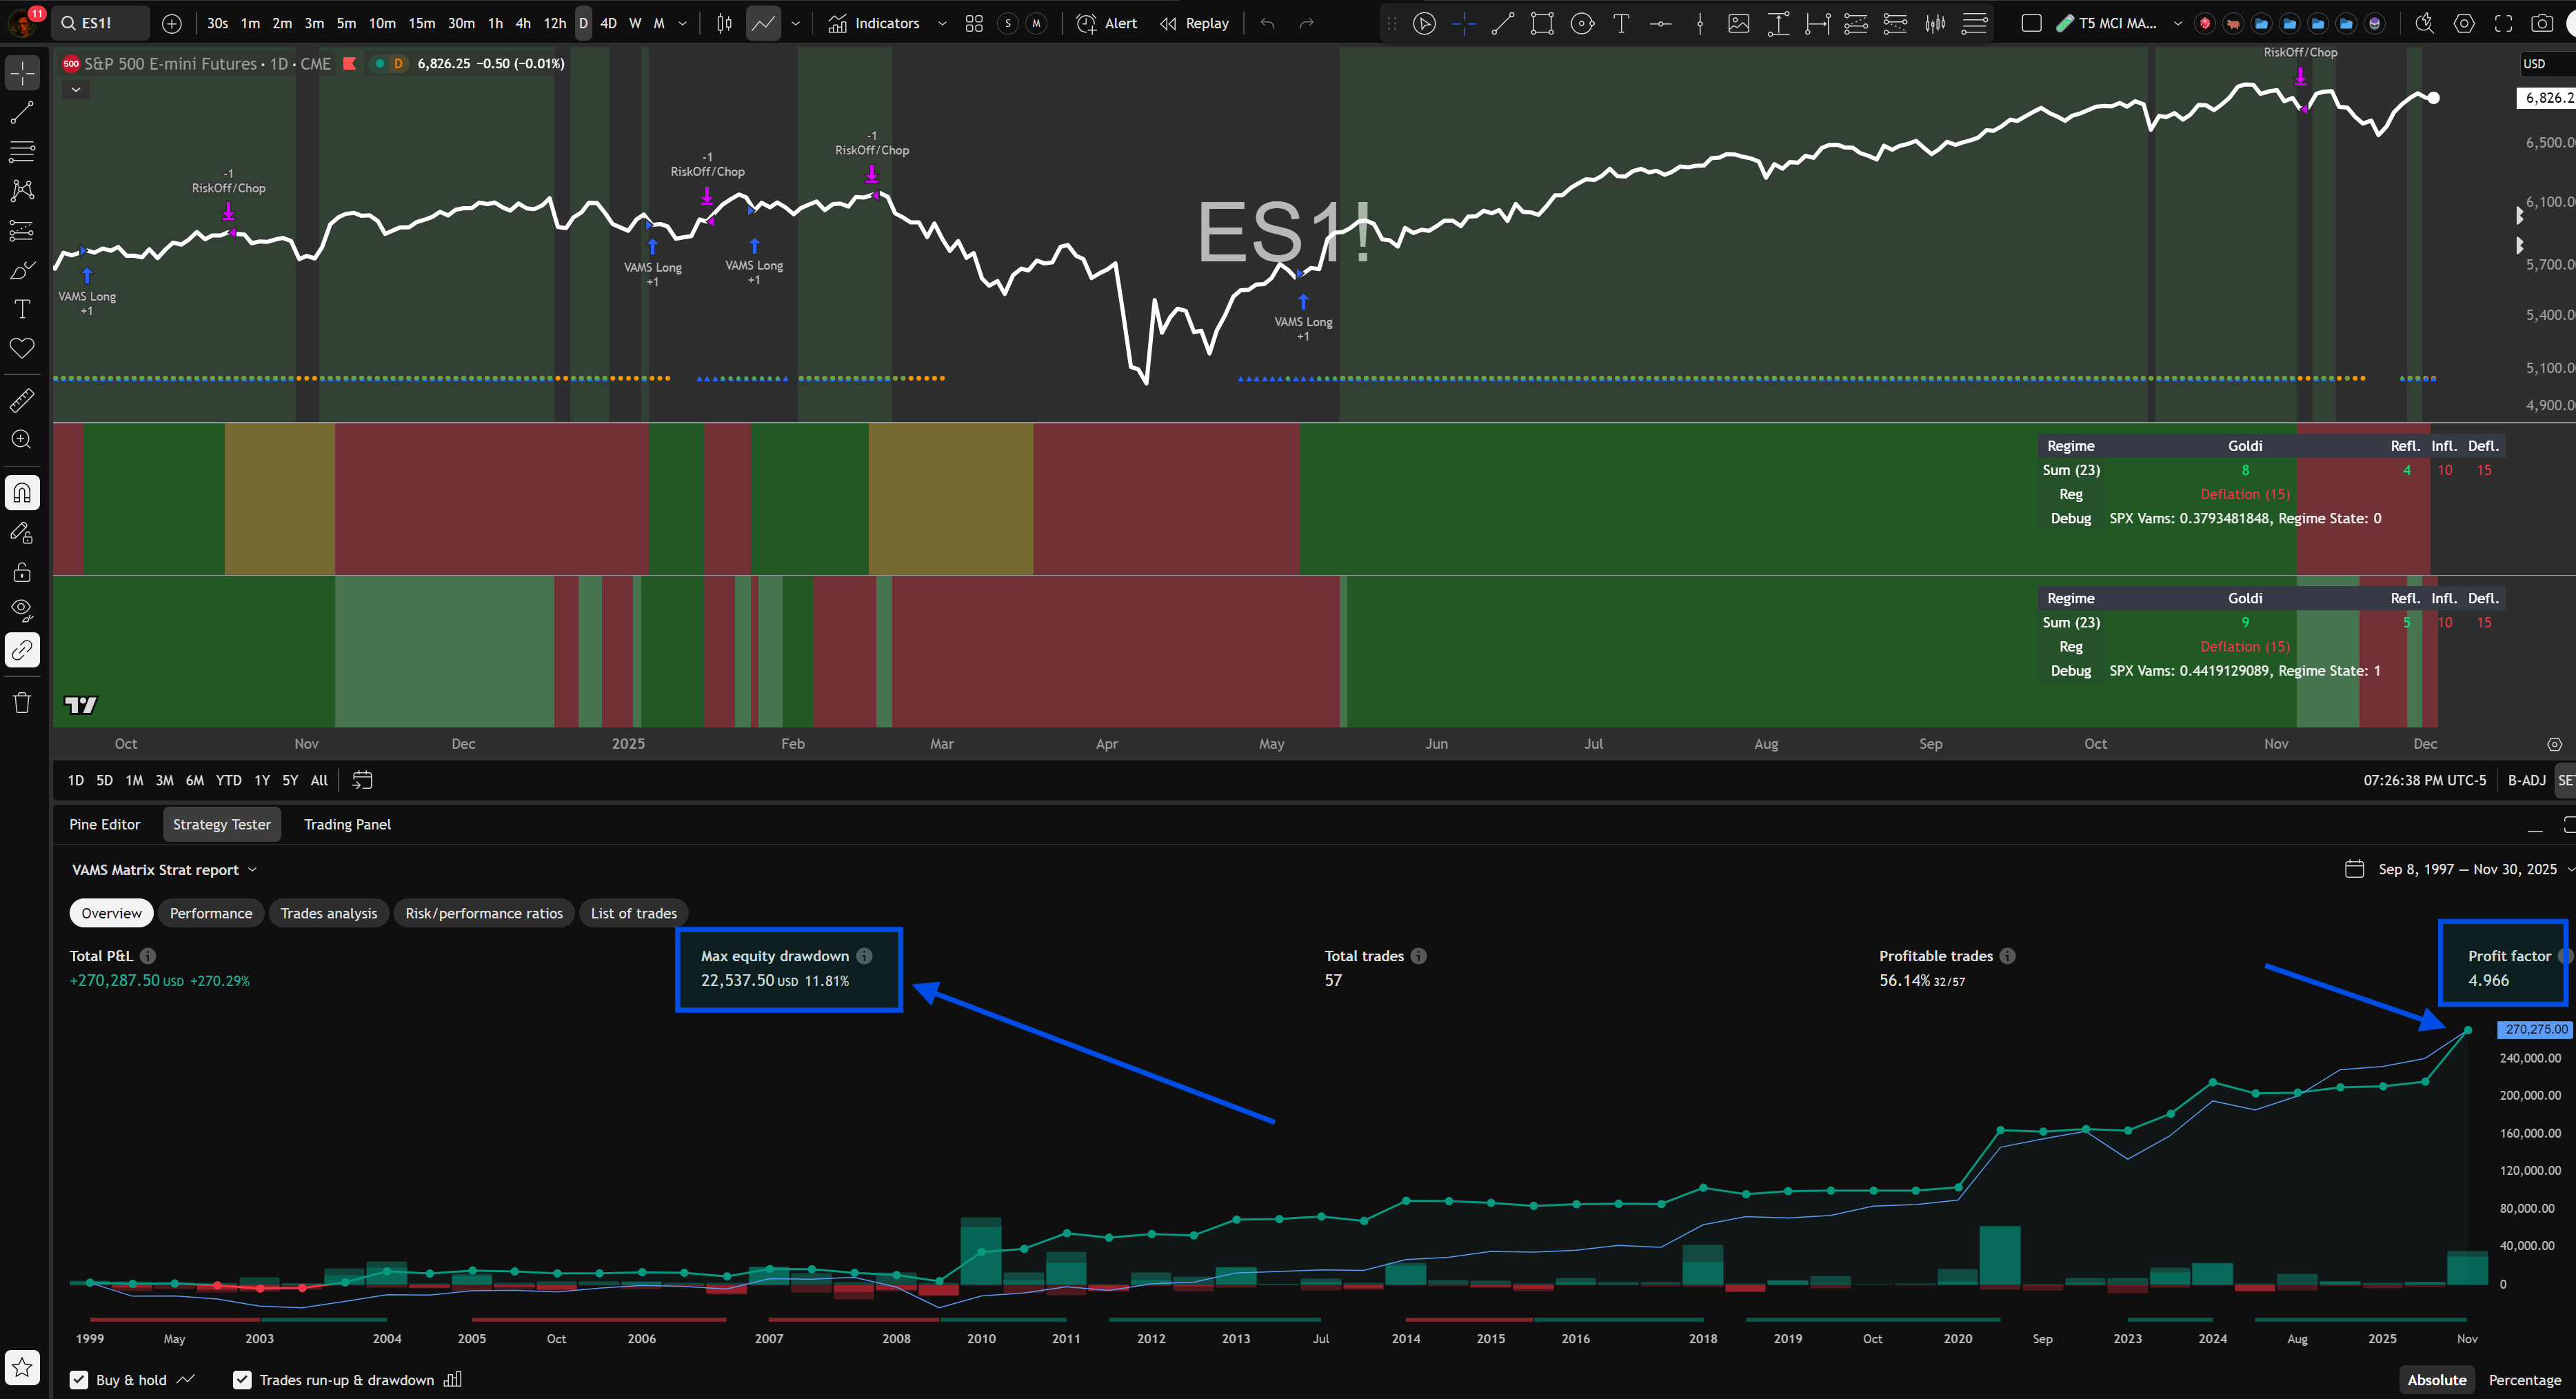
This idea roughly speaking helped me stitch together a Tactical Macro Regime Engine that, on paper, tracks buy-and-hold SPX… with an 11% max drawdown. As a high level risk overlay; this is exactly the kind of trade frequency, drawdown protection & performance I’m looking for because this will enable me to tactically add some percentage of leveraged exposure during these periods to outperform (more on that later).
Each asset’s state (bull/bear) maps to two regimes at once, so you get a 4-way voting system:
Goldilocks votes
Reflation votes
Inflation votes
Deflation votes
Sum them up, and you have four numbers. Highest one wins. That’s the current regime and dictates how you should be positioned at a high level.
4. Teaching It Not to Freak Out Over Every Wiggle
Raw votes are noisy. Markets don’t move in clean four-act plays; my first backtest of this confirmed that theory quite vividly given the system was risk-off for a good portion of the 2014 melt-up.
So I added three layers of sanity:
Minimum votes.
A regime only “counts” if it has at least X confirming assets.Vote lead.
It also has to beat the second-best regime by at least Y votes.
If Goldilocks has 10 votes and Reflation has 9, we need logic around these results.Time confirmation (hysteresis).
Even if a new winner appears, we don’t switch signals immediately. It has to stay in charge for N bars before the regime officially flips.
That gives you a smoothed regime line, reducing the noise and increasing effectiveness. This completed the foundation of the system in a logical sense.
Then I layered on a risk mode, because regimes and portfolio decisions are not the same thing:
Risk Mode 1 – Strong Risk-ON
Goldilocks or Reflation is clearly in charge.Risk Mode 2 – Deflationary Risk-ON
The matrix says Deflation/Inflation, but the growth complex is ripping
(enough growth assets are bullish and SPX is in a VAMS bull).
Think “QE + slowdown but risk assets still melt up.”Risk Mode 3 – Risk-OFF
Deflation/Inflation in control, growth complex not strong enough.
This is where I’d rather be light, hedged or sitting completely in cash.Risk Mode 0 – Chop / Transition
No strong winner. No hero trades. Interestingly enough, in the backtest it was better to be sitting cash during these phases.
On the chart:
Dark green background = Risk-ON (Goldilocks/Reflation)
Light green = Risk-ON but Deflation-flavored (Doesn’t happen often, still making tweaks to this logic)
Red = Risk-OFF
Yellow = Chop (I still treat this as functionally Risk-OFF in the backtest)
5. Daily vs Weekly: Giving Macro a Longer Memory
Early versions of my indicator used daily (timeframe) VAMS for every asset, and it worked… okay. I spent hours fine-tuning each VAMS signal on an asset by asset basis and had a sort of eureka moment.
A lot of these macro-heavy series are slow-moving oil tankers:
Yield curve
TIPS real yield
MOVE
DBC
Breakevens
They don’t care about a Tuesday headline. They care about the next 6–12 months.

So I split the world:
Daily Timeframe VAMS: all the growth / risk stuff (SPX, NQ, RTY, BTC, SXXP, NKY, growth FX, HY spreads, oil, DBC). This keeps the system responsive to trends and corrections.
Weekly (or 4D) Timeframe VAMS: the deep macro plumbing (curves, yields, TIPS, breakevens, MOVE, safety FX). This slows down regime flips and stops the engine from overreacting to a one-week tantrum.
In code it’s literally the same VAMS function, just swapping timeframe.period for “W” on the macro symbols.
The result:
On a daily chart, you still see tactical shifts.
Underneath, the regime engine itself is anchored to weekly macro data where it makes sense.
6. Turning It Into an Actual Strategy (Not Just Pretty Colors)
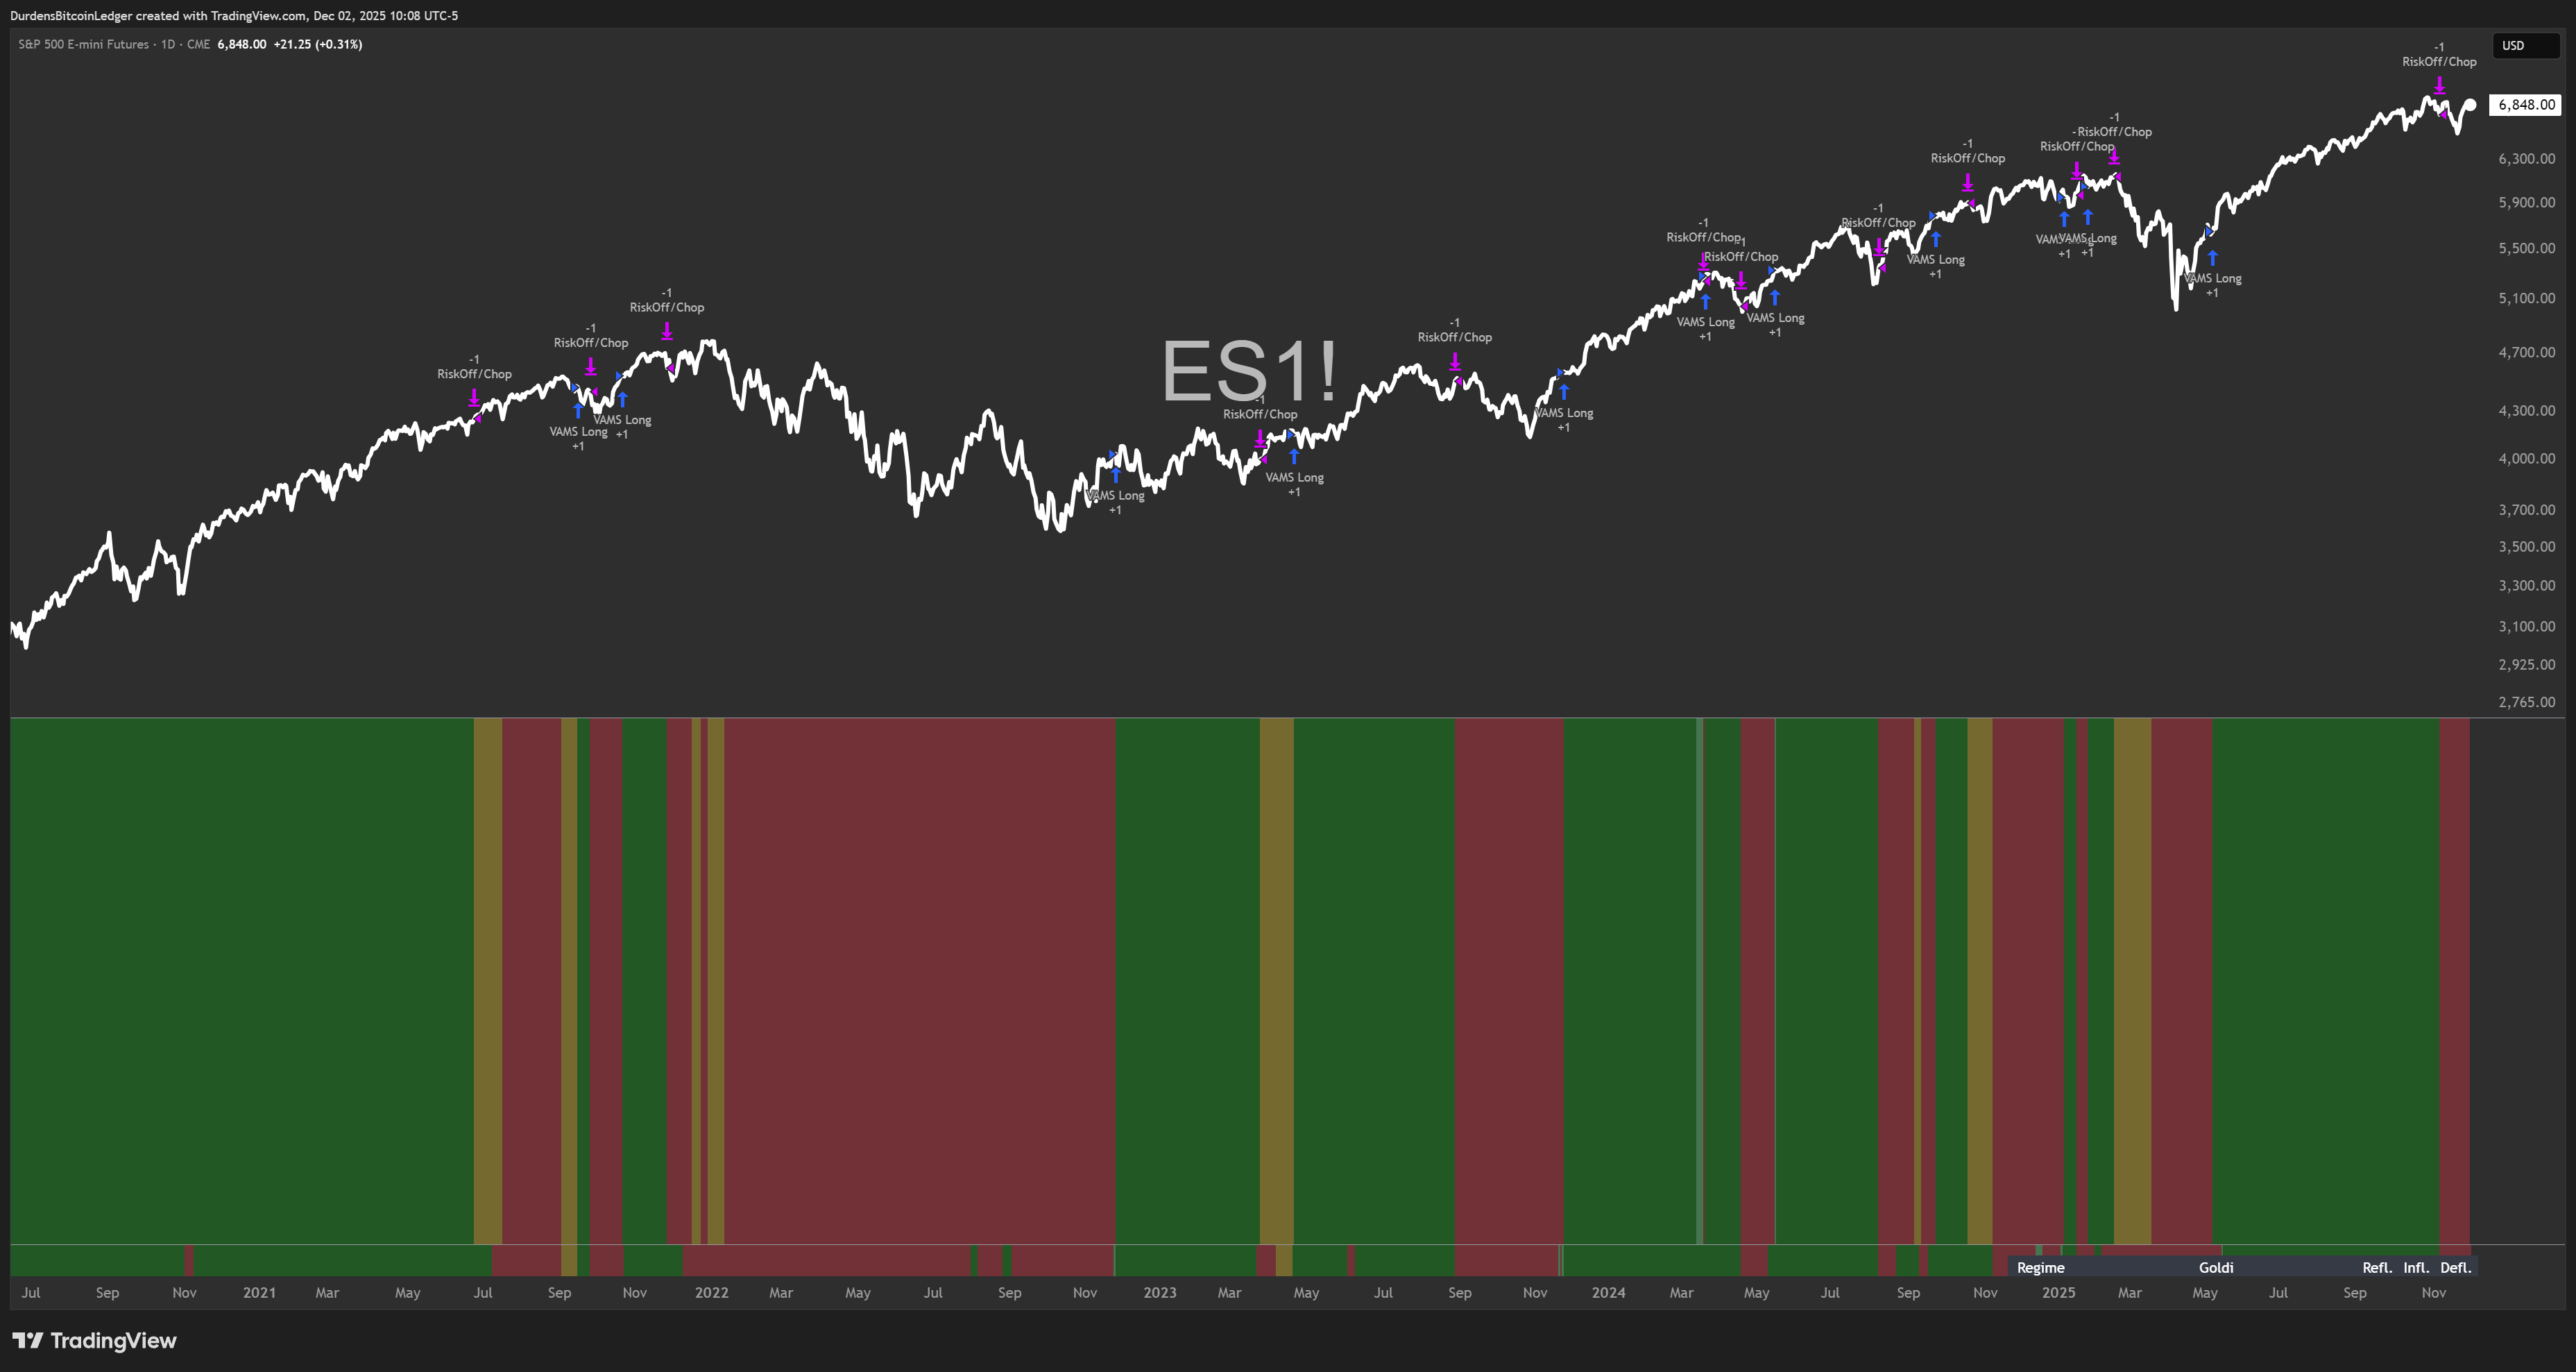
Once the matrix was behaving, I did the irresponsible thing every trader eventually does…I pointed it at ES1! from 1999 onward and asked the stupidest possible question:
‘What if I just buy when it’s green and sit out when it’s red?’
Eyeballing it made me feel good, really good. Now I needed to know the actual stats.
Does this beat buy & hold or at least hold par with it? Does it have less max drawdowns? How many trades would I be doing per year?
It was time to backtest.
So I converted the indicator into a full TradingView strategy:
Entry:
When risk mode flips to 1 (Strong Risk-ON) or 2 (Deflationary Risk-ON), and I’m flat → go 100% long ES (percent-of-equity).
Exit:
When risk mode hits 3 (Risk-OFF). Also exit in Chop.
No shorts.
This is not a “short every bear market” engine. It’s a “don’t be long when the house is on fire” engine.
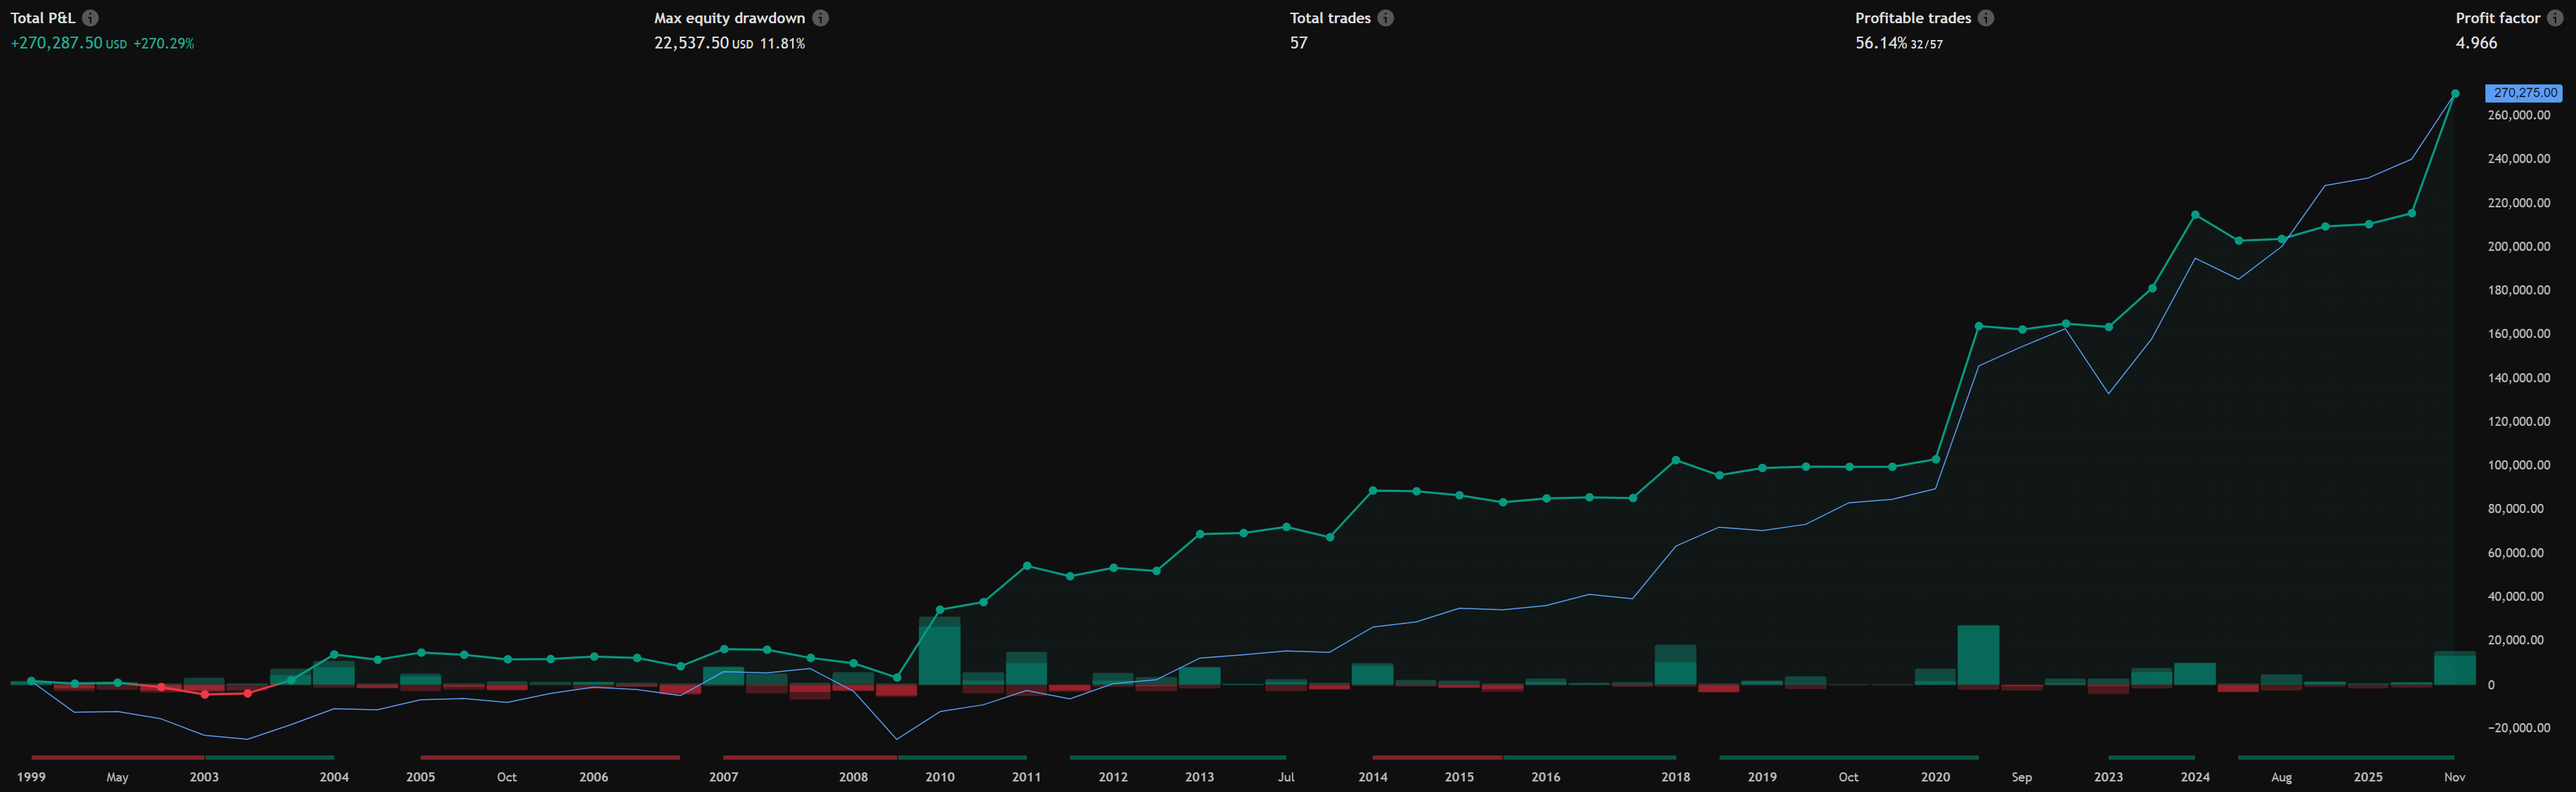
Backtest on ES1! from 1999 → now, with my current daily/weekly mix and settings:
Total P&L: basically in the same neighborhood as buy & hold.
Max drawdown: ~11% vs classic equity market waterboarding.
Profit factor: around 5 in my latest run.
Number of trades: ~50–60, with a bit over half being winners.
No slippage/fees included.
ES1! continuous contract; no roll costs modeled.
Is this statistically perfect? No.
Is it suspiciously good for a first real iteration? Yes.
Do I trust it blindly? Absolutely not.
But here’s the key:
It converts macro confusion into binary positioning decisions.
All while massively cutting drawdowns and only giving up a modest amount of upside vs full buy & hold. In certain cycles it outperforms B&H.
For a survivalist, that’s the trade. For an optimizer, my brain lit up with the amount of things I can overlay on this to squeeze a higher % during risk-on periods.
7. Where It Still Fails (And Why That’s the Whole Point)
Is it perfect? Obviously not. I think the important realization here is that no system will ever be perfect. The objective is to skew the probabilities in our favor as much as possible. The only perfect system would be one where it knows the future. So where does this system underperform?
Some examples:
2014–2015 mush:
That slow grind up with euro crisis hangover and Fed hand-wringing?The matrix sometimes underweights it. The system sees mixed macro and gets defensive, while price quietly trends higher.
That’s the tax you pay for avoiding 2008 and 2022-style events.
Short, violent corrections:
Black swan spikes like COVID can be too fast for weekly macro to fully react to before it’s already halfway over.You may get late exits or quick whipsaws. Luckily the system did really well managing this event.
It’s SPX-biased by design.
I’m optimizing for the S&P as the “global risk benchmark.”That doesn’t mean these exact settings are perfect for BTC, QQQ, or your favorite AI bag. It’s tailored for SPX and SPX only but should do relatively well for most risk assets.
Macro data revisions & FRED quirks:
Some series get revised, some have stale days, some act weird around holidays.The engine handles missing data reasonably, but nothing in macro is as clean as a simple moving average.
In other words:
This is not a holy grail.
This is a macro-aware binary overlay.. think of it as your seatbelt to the markets.
If the cost of avoiding catastrophic accidents is occasionally missing a sunny Sunday drive, I’ll live.
8. How I Actually Intend to Use It
I’m not about to plug this into a black box and go to the beach.
The plan:
Baseline exposure.
ES (and BTC) allocations sized based on VAMS regime.Strong Risk-ON → fully deployed, maybe even running my put-spread overlay.
Deflationary Risk-ON → deployed, but with more hedging / shorter leash.
Risk-OFF → light or flat, hunting hedges, income, or just waiting.
Overlay with tactical tools.
I still use local liquidity dashboards, tuned trend indicators and vol/stress metrics for entries/exits & sizing inside a regime. VAMS doesn’t replace those; it tells me when they matter more or less.Mental model.
The biggest value is psychological:
When that background flips from green to red, I don’t have to argue with myself.
My macro checklist has already voted.
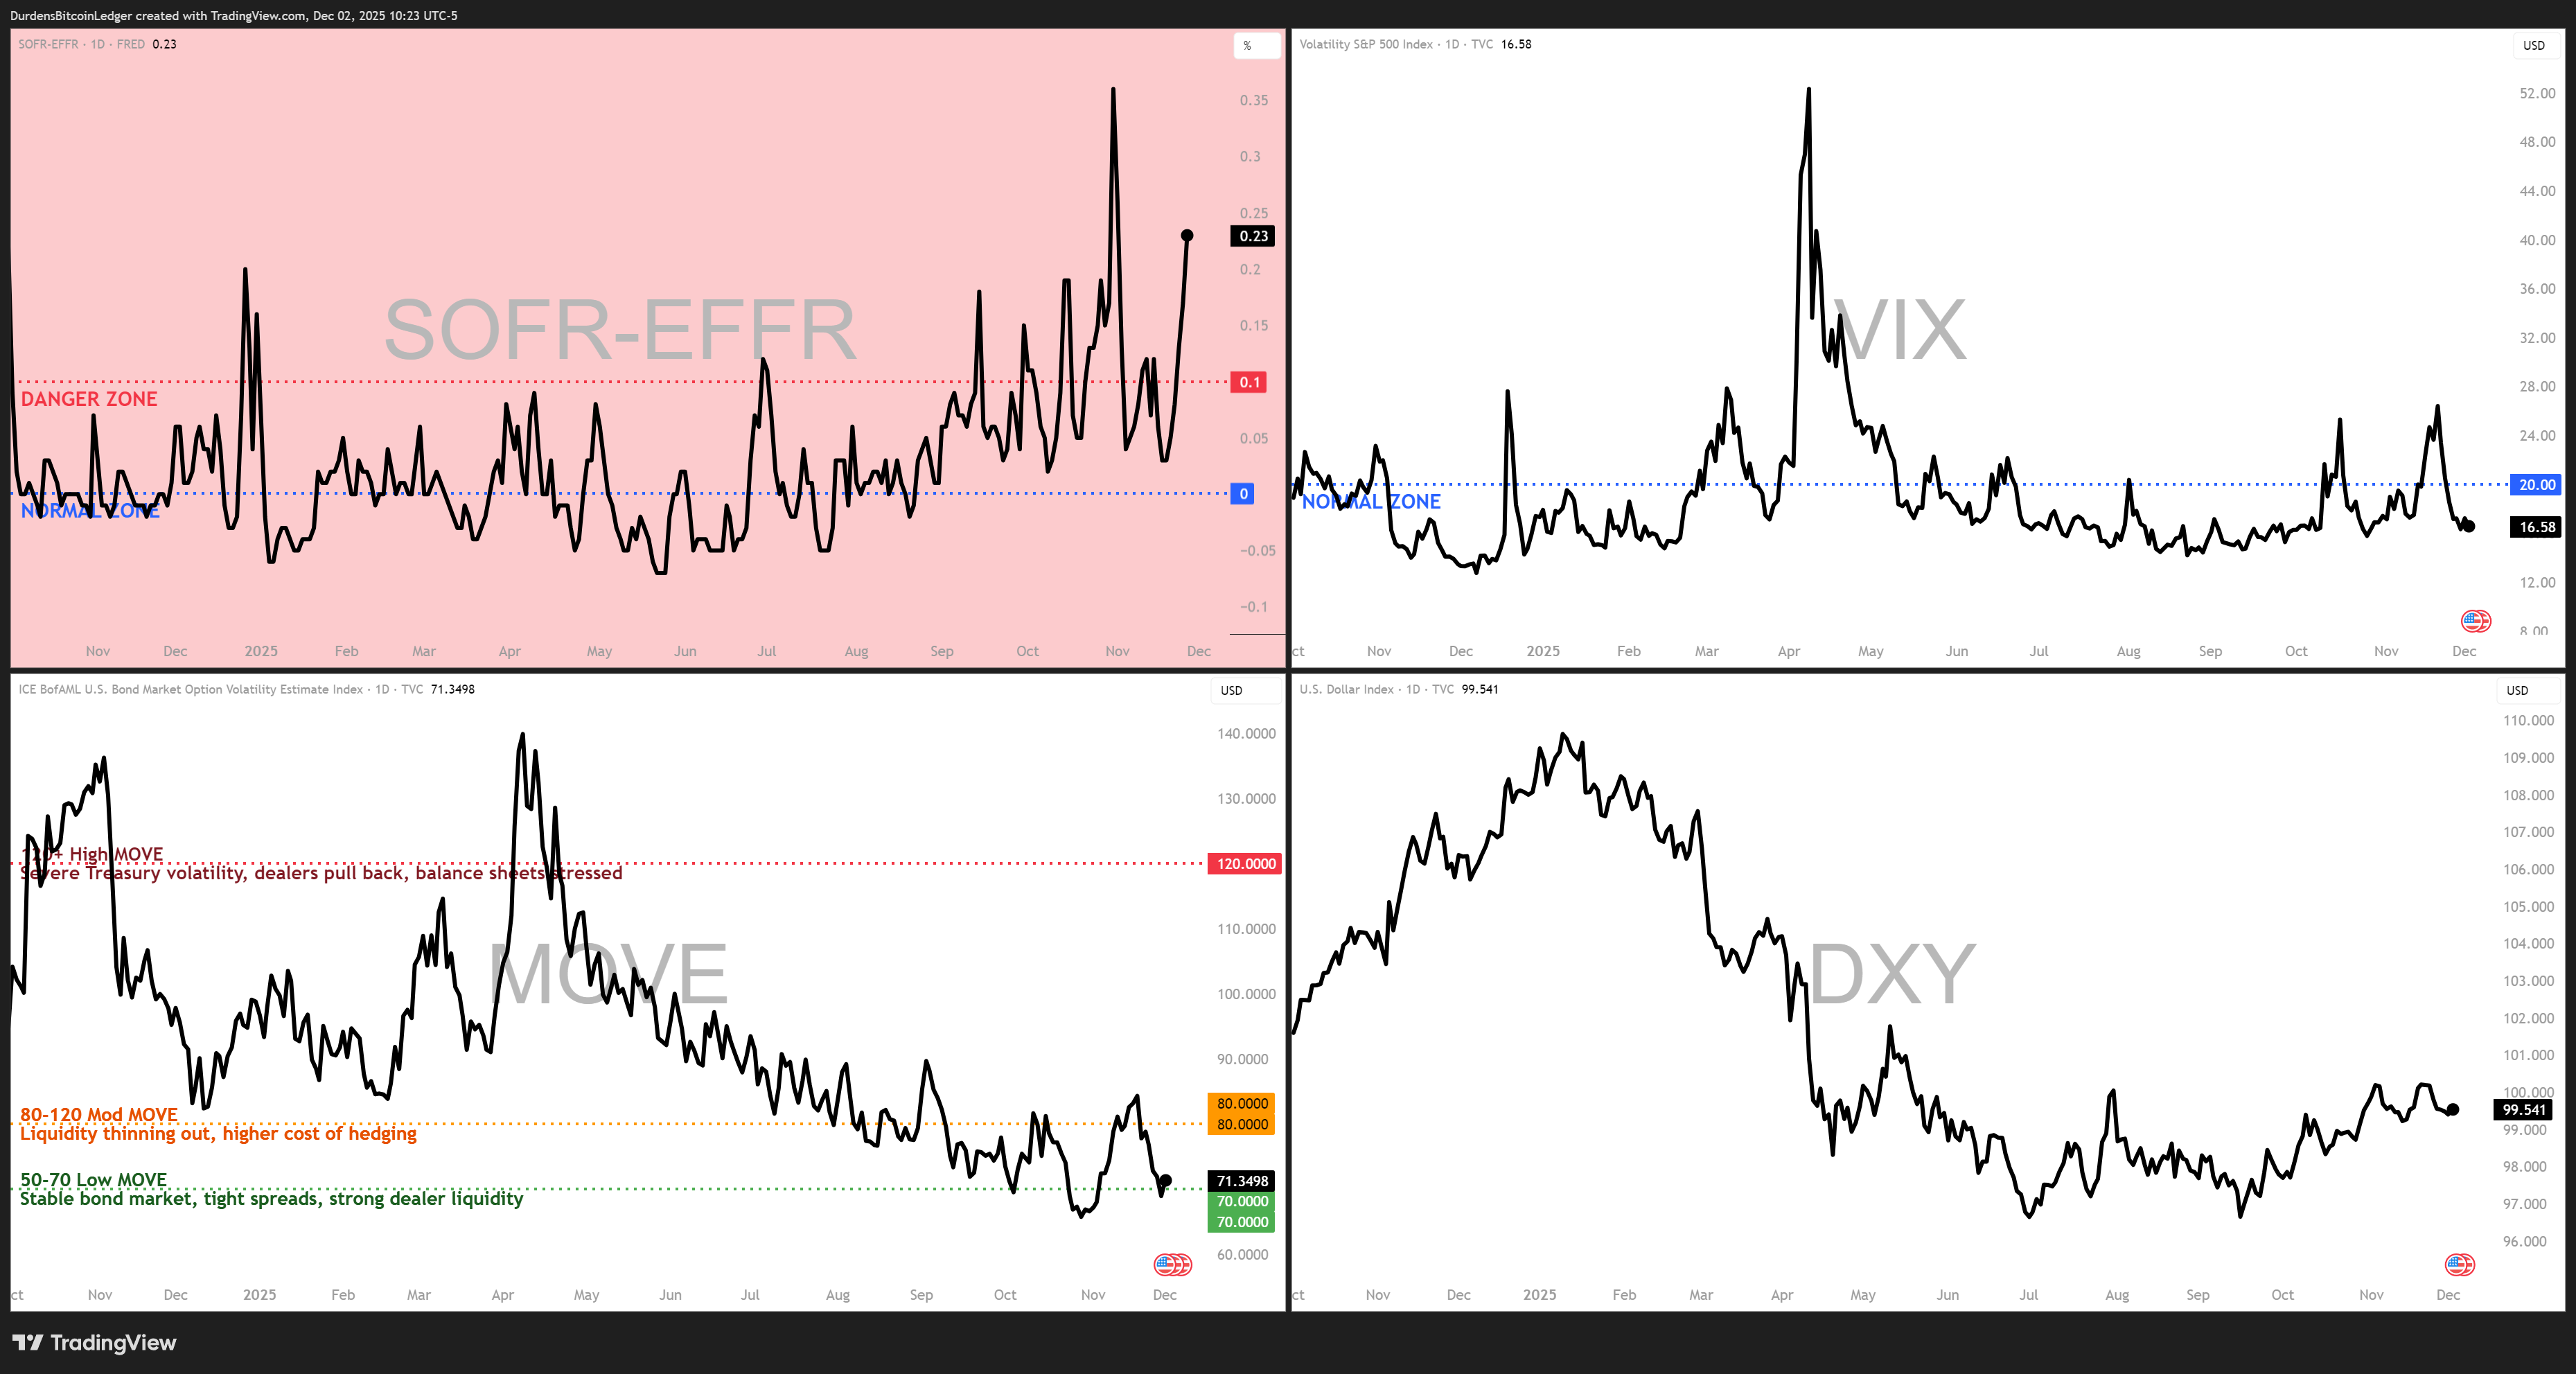
Here is a view of my ‘stress dashboard’ which is a super simple composite of the SOFR Spread, VIX, MOVE & DXY. Feel free to copy it and use it yourself.
9. The Road Ahead
This is Version 0.1. I fully expect it to embarrass me in public at some point.
Things on the roadmap:
Regime-specific position sizing.
Right now it’s basically ON/OFF.Extended individual asset VAMs tuning.
BTC-native variant.
Same framework, but swapping in:on-chain metrics,
global liquidity measures,
stablecoin flows,
BTC-specific vol data.
A lot of these might be difficult or almost impossible on TradingView so Python might be the go-to here.
Cross-asset overlays.
Use the same regime matrix to tell me when to prefer:value vs growth,
gold vs BTC,
long duration vs T-bills,
or just sit in T-bill ETFs and wait.
There is a lot more work to be done and to be frank, the work never ends because all edges decay.. you’re in a constant fight against an ever-shifting landscape.
I’ve mulled over whether to release this publicly for free on TradingView or keep it proprietary and I’ve leaned towards the latter. This will be an ongoing ‘living’ project with no ‘done’ date.
I will share signal switches & updates via my X profile & this substack.
10. Final Thoughts: You Don’t Need Certainty, You Need Exit Routes
The point of this whole project isn’t to “beat the market.”
If you want max upside and max pain, you can just buy SPX, never look at a chart again, and let the Fed do whatever it does between now and 2035.

The point is to have system-driven rules for when the world changes.
When the bond market screams “Deflation,” I want less equity exposure and more capital ready to buy blood.
When commodities and breakevens catch a bid, I want to respect that inflation isn’t “transitory” just because a press release said so.
When growth, credit, and FX all agree the party’s back on, I want to be long, not still hiding under the bed.
That’s what this Macro Regime Engine is:
a way to translate a chaotic macro tape into a simple question:
“Is this a time to survive, or a time to press?”
Right now, Version 0.1 says: you can survive and play offense if you respect the regimes.
If you’ve made it this far and want to see how I iterate on this, hit subscribe, share this with the one trader friend who still thinks “macro is a meme,” and feel free to roast my parameter choices in the comments.
I’ll be in the War Room, arguing with a matrix of 20+ tickers so you don’t have to.
Fin.
— Durden out.
✊🧼
Not financial advice. Manage risk. The market’s real engine is liquidity.
Want the live dashboards behind these insights?
Subscribe on Substack Free subscribers get research updates. Paid subscribers get live macro tools + signal alerts.